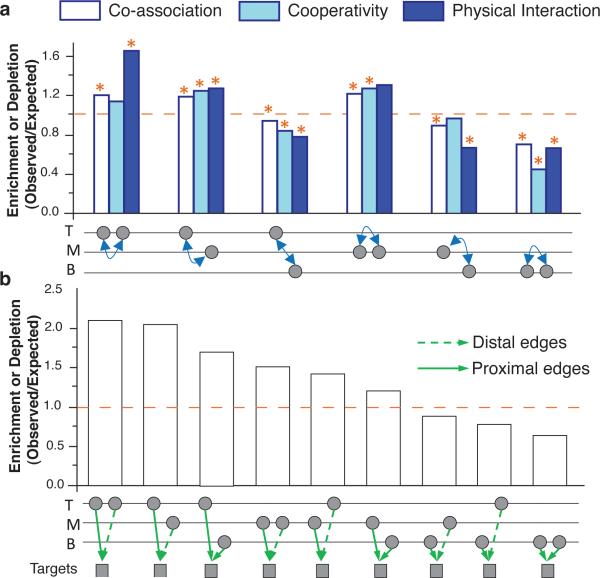
Figure 3. Collaboration between Levels.
(a) Enrichment of collaborating TF pairs from different levels (T,M,B). The TFs are represented by two nodes below each bar graph. The dashed orange line indicates the expected level of collaboration. Significant enrichment above or depletion below that level are marked by asterisks (P<0.05). (More details in SOM/G.1,2.)
(b) Enrichment of proximal and distal co-regulatory pairs in the network hierarchy. Co-regulatory pairs from different levels are shown by the two nodes below each bar.

