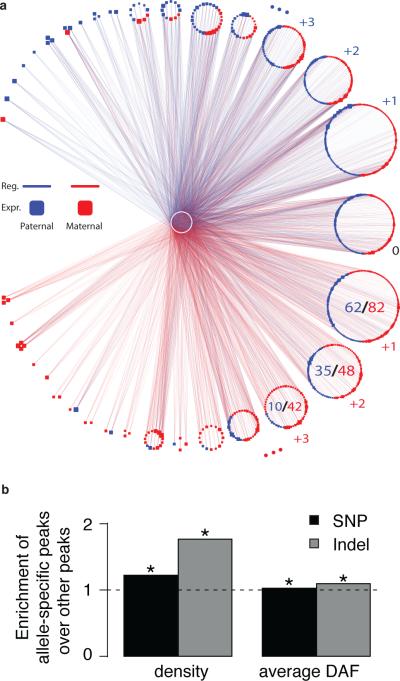
Figure 5. Allelic Effects.
(a) An “allelic effects network” depicting the increasing coordination between ASB and ASE as the number of TFs regulating a target increases. Central white nodes denote TFs, and peripheral nodes denote targets, which are blue (red) if they are expressed from the paternal (maternal) allele. Blue (red) edges denote ASB to the paternal (maternal) allele. This network represents the strongest differences between the paternal- and maternal-specific regulatory networks. As one goes around the larger circle counterclockwise (clockwise), each of the small circular clusters represents targets with progressively more paternal (maternal) regulation, indicated by the small blue (red) numbers to the side of the clusters. Moreover, within each of the clusters the fraction of predominantly paternally (maternally) expressed targets increases as one goes around the larger circle. As an illustration, this fraction is explicitly indicated by the ratios within three of the larger clusters at bottom right.
(b) Relationship between TF allelicity and selection. The bar height is the ratio of the degree of selection (as measured by SNP density or average DAF) in those TF-binding peaks showing allelic behavior to the degree of selection in all other TF-binding peaks. Asterisks represent significant differences (P<0.05, Wilcoxon-rank-sum test).
(More details in SOM/I.2 and Fig S10b,c.)

