Fig. 4.
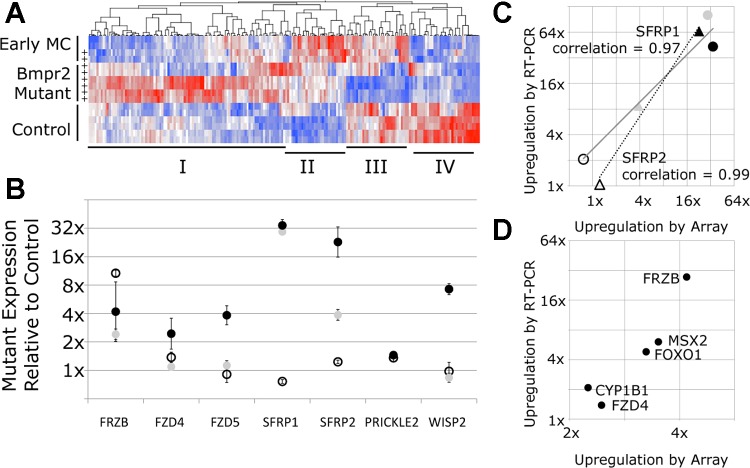
BMPR2 mutation causes increased Wnt pathway gene expression only in differentiated cell types. A: heat map analysis of gene segregation showing high (red) and low (blue) levels of expression. +, Mutant samples. In this set of genes, BMPR2 mutants and control cells are identical in undifferentiated early mesenchymal cells (top 4 rows). With differentiation, BMPR2 mutants display aberrant induction (I), failure of inhibition (II), aberrant inhibition (III), or failure of induction (IV). B: Wnt pathway genes show aberrant induction in BMPR2 mutants. Open circles, early MSC; shaded circles, differentiated MSC; solid circles, ECL cells. Error bars, SE. C: quantitative RT-PCR (qRT-PCR) measurement of secreted Wnt receptor secreted frizzled-related protein (Sfrp-1 and Sfrp-2) expression shows strong correlation between PCR and array measurements at every developmental stage. Open symbols, early MSC; shaded symbols, differentiated MSC; solid symbols, ECL cells; circles, Sfrp-1; triangles, Sfrp-2. Horizontal and vertical axes measure expression in BMPR2 mutants divided by expression in controls. D: qRT-PCR analysis validated gene trends identified in array analysis for FrzB, Fzd4, Msx2, FOXO1, and CYB1B1 in ECL cells. Correlation between qRT-PCR and array is 0.94.

