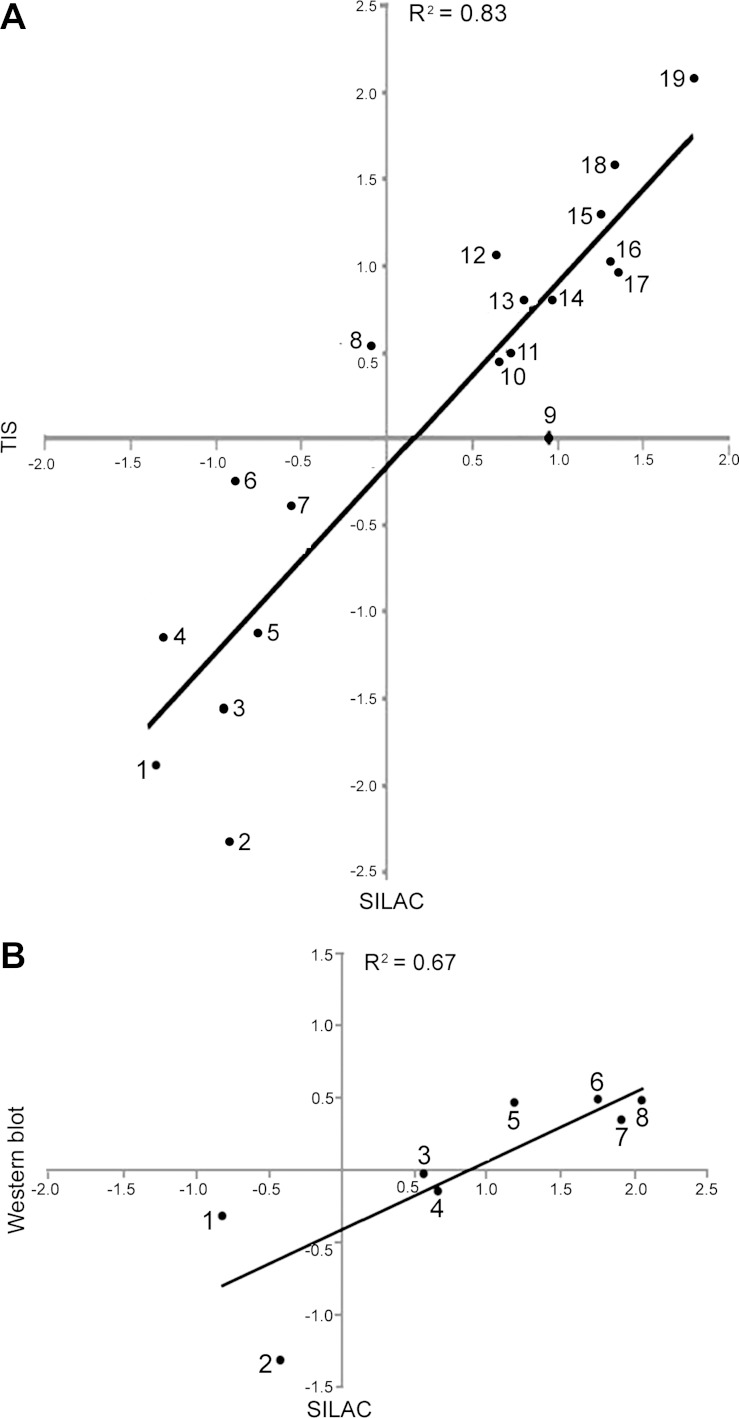
Fig. 3.
Effect of high NaCl on phosphopeptide abundance as determined by TIS vs. SILAC (A) and Western blot with phosphospecific antibodies vs. SILAC (B). Proteins include those whose phosphorylation changed significantly and those whose phosphorylation did not change significantly. Scales are log2(500/300 mosmol/kg). High correlation coefficients between the paired methods support the accuracy of both. Gene symbols-(phosphorylation sites) are as follows: in A, CCNL2(S330) (1), CTTN(T364) (2), GIGYF2(S26) (3), AKT151(S212) (4), TBC1D4(S570) (5), CTNNB1(S552) (6), NEDD4L(S327) (7), GRLF1(S1179) (8), RABEP1 (9), GAPVD1(S929) (10), DTNA(S605) (11), MDC1(S376) (12), MYO9B(S1290) (13), TRIM28(S473) (14), EPS15(S482) (15), DYNC1LI1(S51) (16), MAVS(S222) (17), KIAA1432(S1017) (18), ZFYVE16(S939) (19); in B, G3BP1(S232) (1), MDC1(S964) (2), HDAC1(S421/S423) (3), JUN(S73) (4), STAT1(S727) (5), ATF2(T71) (6), HSPB1/HSP27(S82) (7), JUN(S63) (8).

