
Figure 1.
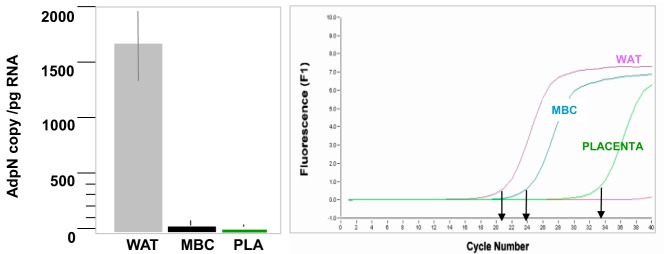
Expression of adpN in maternal blood and the placenta. Left: adpN mRNA expression in maternal adipose tissue, white blood cells, and the placenta was measured by real-time RT-PCR. Results calculated as gene copy numbers were normalized for actin mRNA levels. Data are shown as mean ± SE for tissues sampled from lean women (n = 9). Right: Amplification profile of a representative real-time analysis. WAT, maternal white adipose tissue; MBC, maternal blood cells; pla, placenta.