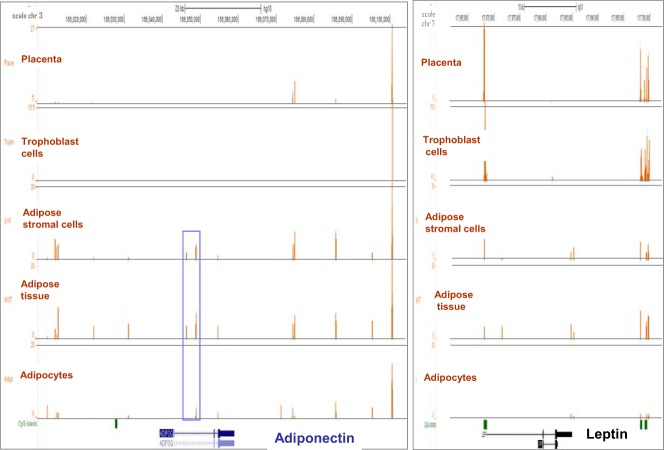
Figure 3.
DNA methylation patterns at the adiponectin locus. Representative DNA methylation pattern in five tissues and cell types obtained from one normal-weight woman at term pregnancy. The x-axis represents > 60 kb of DNA sequence on chromosome 3, and the y-axis represents the number of reads. The brown histograms indicate the number of reads (y-axis, 0–78.5) obtained after MBD isolation in each 100-bp window (x-axis). Annotations from the UCSC genome browser are shown in blue. CpG islands are depicted in green at the bottom of the graphs. Right panel: methylation patterns at the leptin loci for cpmparison. Blue rectangle delineates the sequence spanned by the primers used in methyl-PCR analysis.

