Fig. 1.
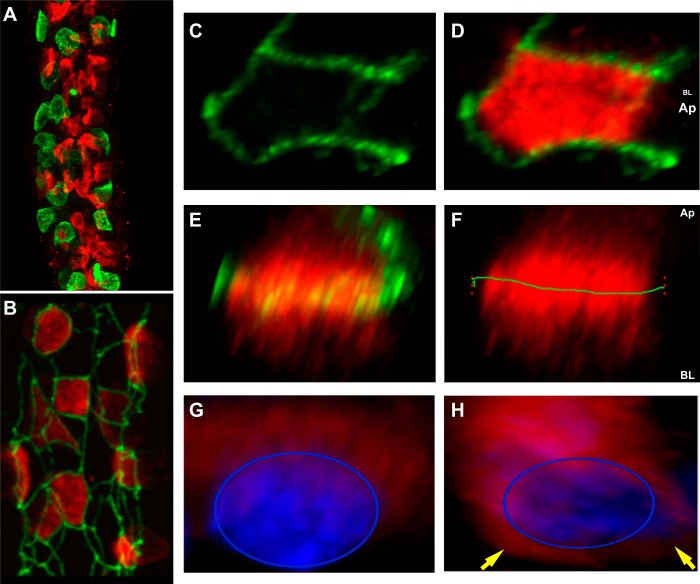
The pendrin cap extends beyond the apical region of β-intercalated cells (ICs). A and B: microdissected cortical collecting ducts (CCDs) from normal rabbit kidney stained for pendrin (red) and anion exchanger (AE)1 (green; A) or zonula occludens (ZO)-1 (green; B). Note that the intensely green dot in A is an adherent red blood cell. C and D: three-dimensional (3-D) reconstructions of an individual β-IC showing ZO-1 (green) bordering the pendrin cap (red). E and F: the same cell rotated such that ZO-1 demarcates the apical cell boundary, as illustrated by the green line across the pendrin cap (F). The green 1 refers to the region of interest in Fluoview software. G and H: 3-D reconstructions of individual β-IC viewed from the lateral perspective stained for pendrin (red) and nuclei (blue). Yellow arrows point to perinuclear pendrin staining extending beyond the pendrin cap region. AP, apical side; BL, basolateral side; BL/AP, apical surface in the foreground and basolateral surface in the background.

