Fig. 2.
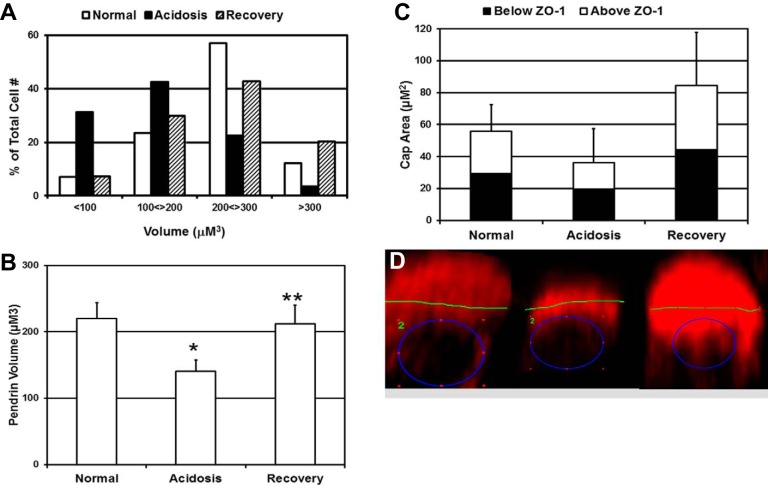
Acidosis reduces pendrin cap volume without changing distribution with respect to ZO-1. A and B: distribution (A) and means ± SE (B) for pendrin cap volumes measured in Z-stack images of microdissected CCDs obtained by confocal microscopy. Results presented are from 3 rabbits for each acid-base condition, a minimum of 3 microdissected CCDs from each rabbit, and a total of between 300 and 400 cells analyzed for each acid-base condition. C: mean ± SE values for pendrin cap area, above and below ZO-1, for the indicated acid-base condition. Results were from 2 rabbits per acid-base condition, 3 CCDs for each rabbit, and a total of 25–98 cells for each acid-base condition. *Normal → acidosis: P < 0.005; **acidosis → recovery: P < 0.005. D: ImageJ was used to measure pendrin cap areas (red) in two-dimensional images of individual β-ICs viewed from the lateral perspective. The blue circle defines the outer edge of nuclear staining, whereas the green line represents ZO-1 staining in the horizontal plane, delineating the apical surface. The green 2 represents the particular region of interest in Fluoview software. Left, cell from a normal rabbit; middle, cells from an acidotic rabbit; right, cell from a recovering rabbit. *Normal → acidosis: P < 0.005; **acidosis → recovery: P < 0.005.

