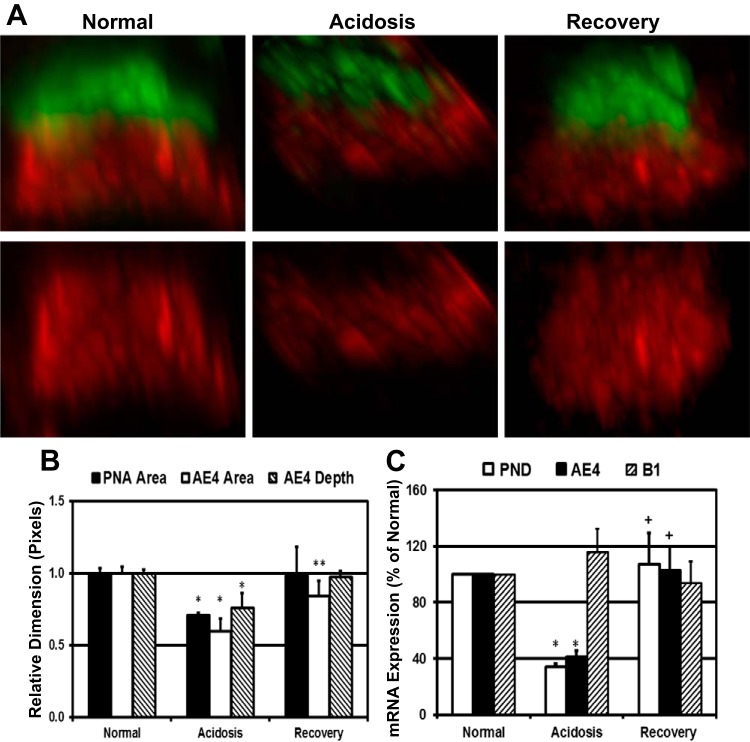
Fig. 5.
Acidosis reversibly reduces AE4 (SLC4A9) expression in β-ICs. A: 3-D reconstructions of confocal images from representative β-ICs within microdissected CCDs from rabbit kidneys adapted to the specified acid-base conditions. Top, lateral views of β-ICs stained with AE4 antibody (red) and PNA (green); bottom, AE4 structure sans PNA. B: morphometric analysis of the PNA cap and AE4 staining in the lateral view using Fluoview. For comparison, the average value for normal rabbit CCDs was set to 1. PNA cap area measurements were derived from 2–3 rabbits for each acid-base condition; AE4 morphometrics were generated from 4–6 rabbits/condition. In each case, 2–3 microdissected CCDs from each rabbit were analyzed. Total number of cells analyzed for AE4 morphometrics were as follows: normal, 194; acidosis, 139; and recovery, 265. *Normal → acidosis: P < 0.0125; **acidosis → recovery: P < 0.016. C: relative abundance of pendrin and AE4 mRNA in the rabbit kidney cortex during the specified acid-base conditions. The average pendrin, AE4, and B1-V-ATPase mRNA copy number in the cortex from normal rabbits was set to 100%. Normal: n = 9 rabbits/condition, acidosis: n = 7 rabbits/condition, and recovery: n = 7 rabbits/condition. *Normal → acidosis: P < 0.001; +acidosis → recovery: P < 0.015.

