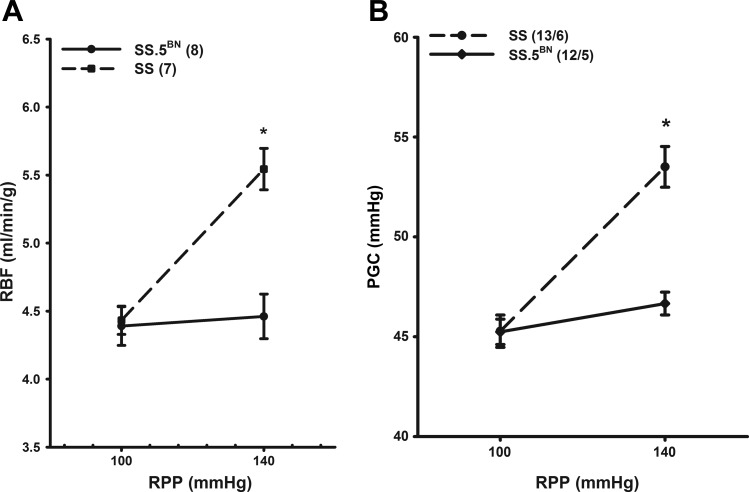
Fig. 4.
Comparison of the changes in renal blood flow (RBF; A) and glomerular capillary pressure (PGC; B) to the elevations in renal perfusion pressure (RPP) from 100 to 140 mmHg in SS and SS.5BN rats. Values are means ± SE. Numbers in parentheses indicate the number of tubules and rats studied per group. *P < 0.05, significant difference from the corresponding control value.

