
Figure 1. HSF2 remains active and HSF1 is activated in vivo by fetal alcohol exposure in the developing brain.
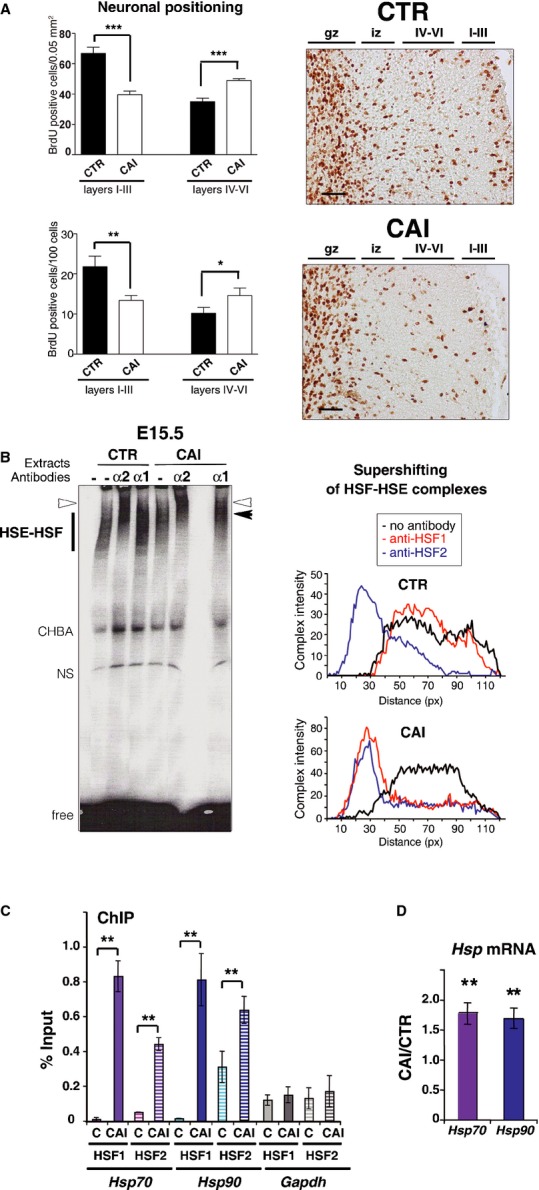
A CAI disturbs neuronal positioning in the outer cortical layers (I–III). (Left) BrdU-labeled cells (BrdU injection at E16.5 and neuronal positioning examined at P0) in fetal cortices from embryos of pregnant dams chronically intoxicated with food containing EtOH ad libitum (CAI), per 0.05 mm2 (n = 5 sections from five different individuals for each conditions; upper panel; P = 0.0004 for layers I–III and P = 0.0006 for layers IV–VI) or per 100 cells (lower panel; P = 0.01 and P = 0.05). Superficial layers, I–III; deep layers, IV–VI; *P ≤ 0.05; **P ≤ 0.01; ***P < 0.001. Differences were considered statistically significant when P-values were ≤ 0.05, using unpaired two-way Student's t-test. Data are presented as mean ± SEM (Right) representative images corresponding to panels on the left. Gz, germinal zones; iz, intermediate zone; IV–VI and I–III, deep and superficial layers, respectively. Scale bars: 10 μM.
B Fetal cortices exposed to alcohol display both HSF1 and HSF2 DNA-binding activities. Gel-shift analysis of HSF1 and HSF2 DNA-binding activity in cortices at E15.5. (Left) The presence of HSF1 and/or HSF2 in the HSF–HSE complex analyzed by supershifting (arrowhead) with anti-HSF1 (α1; black arrowhead) or anti-HSF2 antibodies (α2; white arrowhead). HSF–HSE: HSF–HSE complexes. CHBA: constitutive HSE-binding activity, which is not carried by HSFs and is very variable from one sample or condition to another (Mosser et al, 1988; Abravaya et al, 1991); NS, non-specific DNA–protein complex; free: unbound HSE oligonucleotides. Each lane corresponds to three pooled cortices. (right) Quantification of the intensity and supershifting of HSF–HSE complexes.
C HSF1 and HSF2 occupy the Hsp70 and Hsp90 gene promoter region upon CAI in vivo. ChIP experiments in fetal cortices from control (C) or chronically intoxicated dams with EtOH (CAI). The occupancy of Hsp70 and Hsp90 gene promoter regions by HSF1 or HSF2, was quantified by quantitative PCR analysis by ratio of the ChIP signal versus input signal. Gapdh was used as a negative control. Quantification was carried out in cortices from n = 6 independent litters for CAI and n = 3 independent litters for controls. Hatched bars: ChIP with anti-HSF2. Solid bars: ChIP with anti-HSF1. P-values: **P ≤ 0.01. For Hsp70: P = 0.001482 for HSF1 enrichment in CAI compared to CTR and P = 0.000686 for HSF2. P-values for Hsp90: P = 0.001517 for HSF1 enrichment in CAI compared to CTR and P = 0.000338 for HSF2. No significant P-values for Gapdh: P = 0.176985 for HSF1 enrichment in CAI compared to CTR and P = 0.195512 for HSF2. Differences were considered statistically significant when P-values were < 0.05, using unpaired two-way Student's t-test. Data are presented as mean ± SEM.
D Quantitative RT-PCR analysis of the Hsp70 and Hsp90 mRNAs. Ratio between levels of chronically intoxicated (CAI) embryonic cortices versus control cortices (C); n = 8 independent litters for each gene. P-values: **P ≤ 0.01. For Hsp70, P = 0.003345; for Hsp90, P = 0.007810. Color code: purple for Hsp70 and blue for Hsp90 in all Figures. Differences were considered statistically significant when P-values were < 0.05, using unpaired two-way Student's t-test. Data are presented as mean ± SEM.
See also Supplementary Figs S1 and S2.
Source data is available for this figure.