
Figure 2. Alcohol affects HSE occupancy by HSF1-HSF2 and expression of genes that control neuronal migration.
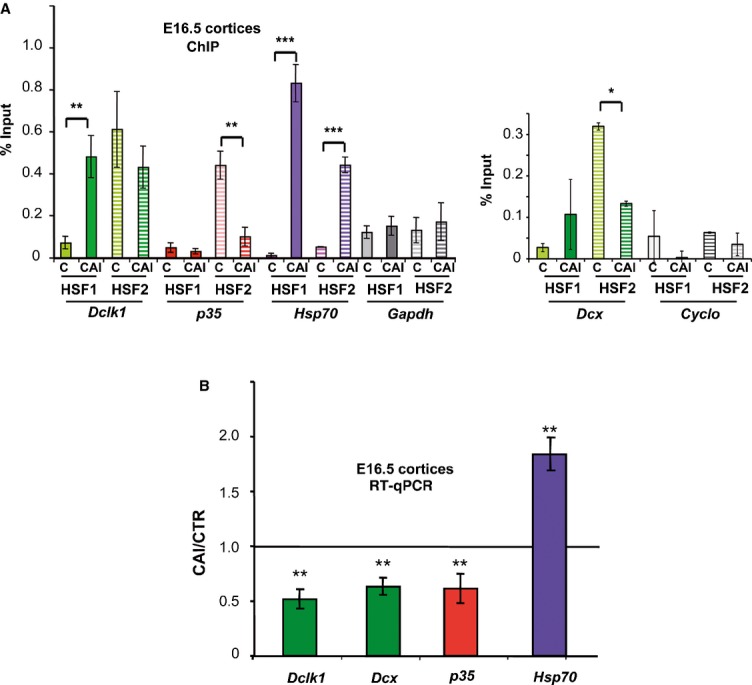
A Quantification of the occupancy of HSE by HSF1 or HSF2 using ChIP and quantitative PCR (ratio of the ChIP signal versus input signal) on Dcx, Dclk1, p35 and Gapdh or Cyclophiline B genes in E16.5 fetal cortices from control dams (C) or those subjected to CAI (CAI); for Dclk1, p35 and Gapdh, n = 6 independent litters for CAI; n = 3 independent litters for controls; for Dcx and Cyclophiline B, n = 2 independent litters for C and n = 3 for CAI. Hatched and solid bars: ChIP with anti-HSF2 and anti-HSF1, respectively. Color code for gene families: Dcx and Dclk1 (green), p35 (red). P-values for Hsp70: P = 0.001482 for HSF1 enrichment in CAI compared to C, and P = 0.000686 for HSF2; for Dclk1: P = 0.00364 for HSF1 and no significant P-value for HSF2 (P = 0.145678); for p35: P = 0.00431 for HSF2, no significant P-values for HSF1 (P = 0.151345); for Dcx: P = 0.03345 for HSF2, no significant P-value for HSF1 (P = 0.102345) for HSF1. ***P ≤ 0.001; **P ≤ 0.01; *P ≤ 0.05. For Dcx and p35: significant reduction in (or no) enrichment for HSF2 in CAI compared to C; no significant enrichment for HSF1, respectively; no enrichment of HSF2 or HSF1 for Gapdh (P = 0.176985 for HSF1 and P = 0.195512 for HSF2) and Cyclo (P = 0.162546 for HSF1 and P = 0.186584 for HSF2). Differences were considered statistically significant when P-values were < 0.05, using unpaired two-way Student's t-test. Data are presented as mean ± SEM.
B Quantitative RT-PCR analysis of mRNAs for Dcx, Dclk1, p35, and Hsp70. Ratio of levels in chronically intoxicated versus control embryonic cortices [n = 8 independent litters for each gene, except p35 (n = 6)]. Note that these genes were affected by more than 20%, a cutoff that we used to distinguish non-affected to affected genes. Asterisk: ratio significantly different from 1. P-values: **P ≤ 0.01. For Hsp70, P = 0.003345; for Dclk1, P = 0.001649; for Dcx, P = 0.0006864; for p35, P = 0.0053387. Same color code as in Fig 1C and D and 2A. Differences were considered statistically significant when P-values were < 0.05, using unpaired two-way Student's t-test. Data are presented as mean ± SEM.
See also Supplementary Figs S3 and S4.