
Figure 5. HSF2 is essential for the binding of HSF1 to HSE upon EtOH exposure.
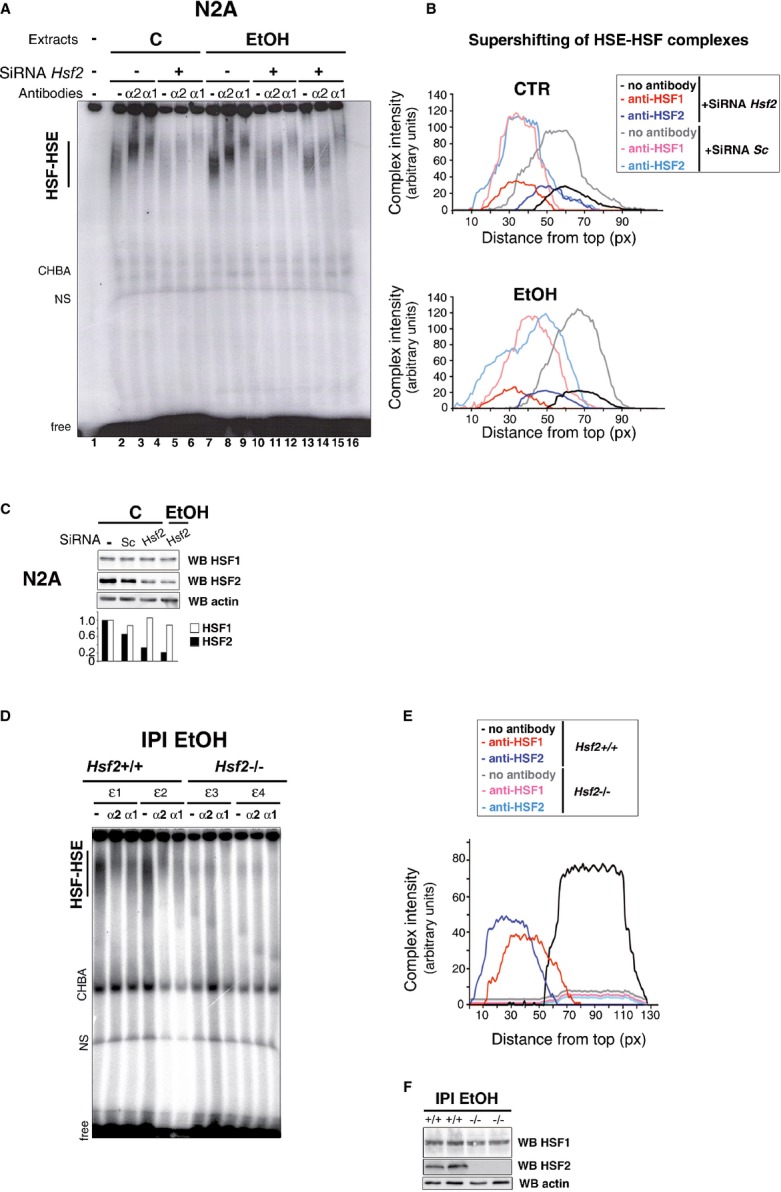
A Gel-shift analysis of the impact of Hsf2 siRNA (+) or scrambled siRNA (−) on the migration of the HSF complex upon EtOH exposure (0.5 h at 2%). Lanes 11–13 and 14–16 represent duplicates, and the (EtOH+SiRNA Hsf2) curves in (B) correspond to their average values.
B Quantification of the intensity and supershifting of the HSF–HSE complexes corresponding to (A).
C Representative immunoblot of HSF1 and HSF2 levels in N2A cells after HSF2 silencing by two distinct Hsf2 siRNAs or scrambled siRNA (Sc) in control (C) or stressed N2A cells.
D Representative gel-shift analysis of cortical extracts from individual Hsf2+/+ (ε1 and ε2) or Hsf2−/− (ε3 and ε4) E18.5 fetuses, 2 h after EtOH (3 g/kg) intraperitoneal injection (IPI) of the mother. IPI was chosen in this case, to circumvent frequent fetal death of Hsf2−/− embryos that frequently occurred in CAI. Note that HSE–HSF complexes are totally supershifted by either anti-HSF1 or anti-HSF2 antibody in extracts from Hsf2+/+ fetuses.
E Quantification of the intensity and supershifting of the HSF–HSE complexes corresponding to (D).
F Representative immunoblot of the levels of HSF1 and HSF2 in Hsf2+/+ and Hsf2−/− embryonic cortices upon EtOH IPI.
See also Supplementary Fig S10A.
Source data is available for this figure.