
. 2014 Apr-Jun;6(2):45–49. doi: 10.4103/0974-7753.138584
Copyright: © International Journal of Trichology
This is an open-access article distributed under the terms of the Creative Commons Attribution-Noncommercial-Share Alike 3.0 Unported, which permits unrestricted use, distribution, and reproduction in any medium, provided the original work is properly cited.
Figure 1.
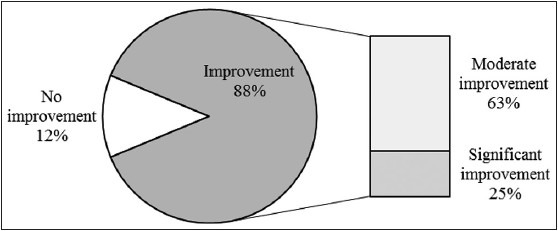
Graphic summary of results