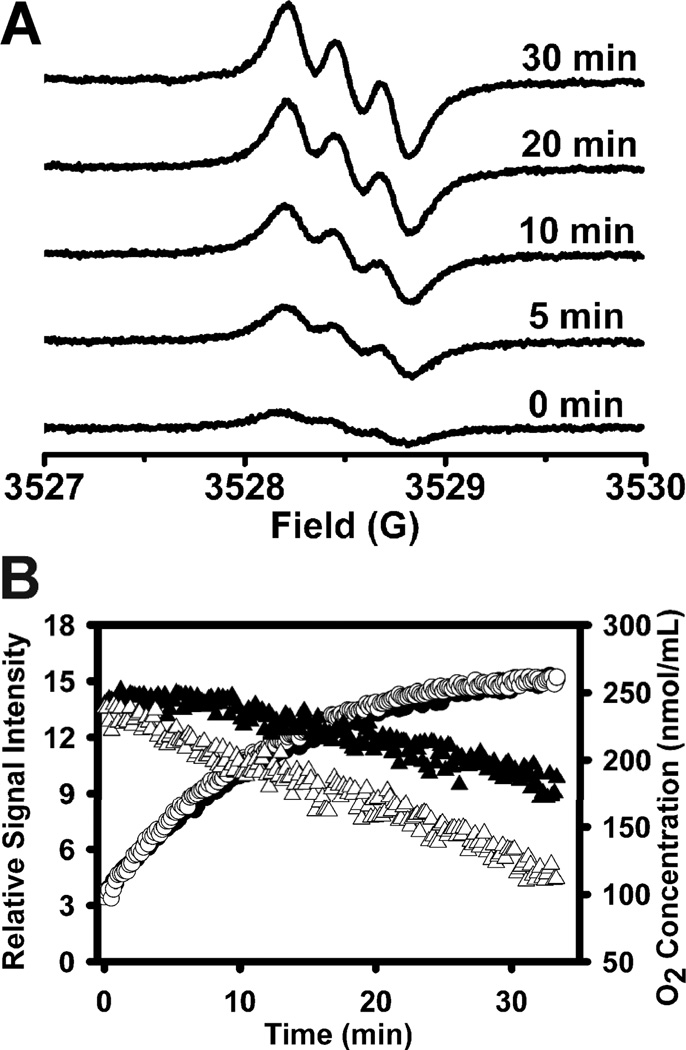
Figure 4.
(A) Time-dependent EPR spectra obtained by incubating TN1 (50 µM) with fresh rat liver homogenate (1.8 mg protein/mL) in the presence of succinate (50 mM) in a sealed capillary. (B) Variations of EPR signal double integration (circle) and O2 concentration (triangle) with time in the presence (unfilled) or absence (filled) of succinate. Spectra were recorded with 5 mW microwave power and 0.03 G modulation amplitude.

