
Figure 1.
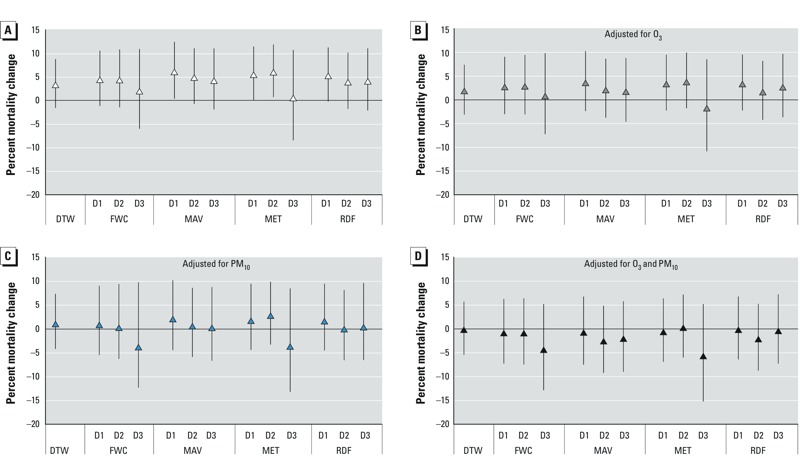
Estimated percentage difference in mortality associated with observed and forecast ATlag01 of 25.3°C compared with 8.5°C during the summertime (May–September) in Detroit, 2002–2006, with and without adjustment for air pollution. All models were adjusted for heat wave days, day of the week, day of the year, and calendar year. (A) No air pollution adjustment, (B) adjusted for same-day mean O3 concentration, (C) adjusted for mean PM10 concentration on the previous day, (D) adjusted for O3 and PM10 concentrations. Abbreviations: D1, forecast 1 day in advance; D2, forecast 2 days in advance; D3, forecast 3 days in advance; DTW, observed data.