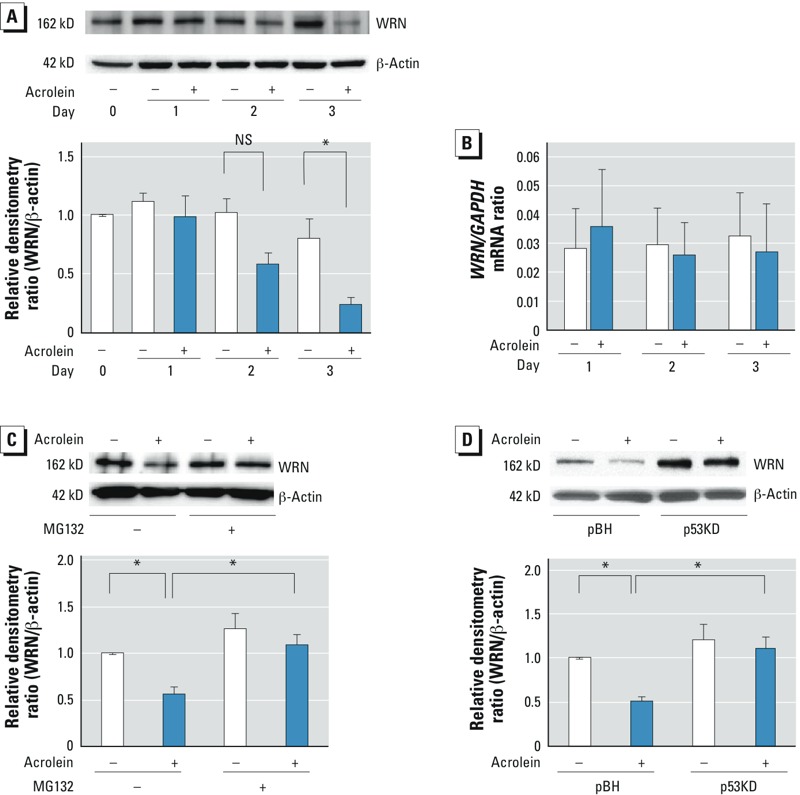
Figure 3.

Effects of proteasome inhibition on acrolein-induced WRN protein degradation. WRN protein (A) and WRN and GAPDH mRNA (B) in HFL‑1 cells cultured in the absence (–) or presence (+) of 25 μM acrolein for 1, 2, or 3 days. (A) Protein levels were evaluated by immunoblot analysis (top); values are expressed as the relative densitometry ratio (WRN protein/β-actin), with each day 0 control regarded as 1.0 (bottom). (B) Steady-state levels of WRN and GAPDH mRNA were quantified by RT-PCR; values are expressed as the ratio of WRN to the GAPDH control. (C) WRN protein in HFL‑1 cells cultured without or with 25 μM acrolein for 48 hr and then incubated with 10 μM MG-132 or DMSO vehicle for 2 hr. (Top) Protein levels were evaluated by immunoblot analysis; (bottom) values are expressed as the relative densitometry ratio (WRN protein/β-actin), with the vehicle control regarded as 1.0. (D) WRN protein in transduced HFL‑1 cells [p53KD (p53-deficient) and pBH (control)] [p53KD (p53-deficient) or pBH (control)] cultured in the absence or presence of 25 μM acrolein for 2 days. (Top) Protein levels were evaluated by immunoblot analysis; (bottom) values are expressed as the relative densitometry ratio (WRN protein/ β-actin), with the pBH control regarded as 1.0. For A–D, data are expressed as mean ± SEM of three independent experiments. NS, not significant. *p < 0.05.
