
Figure 2.
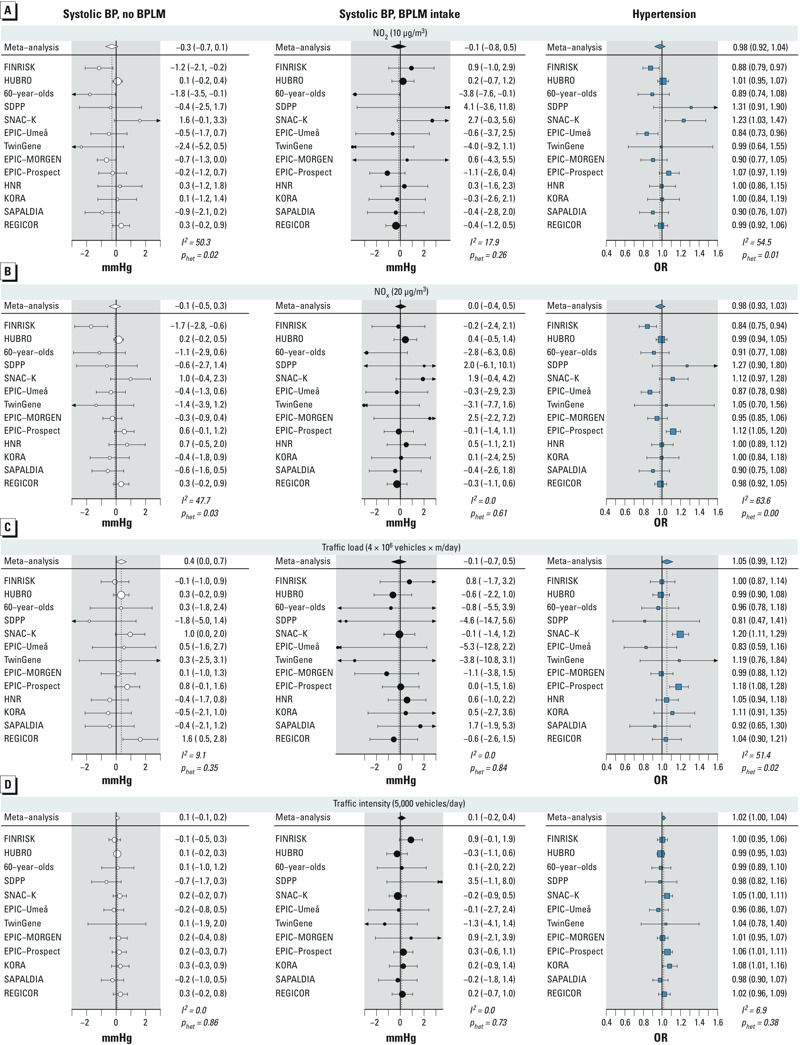
Cohort-specific and meta-analysis estimates of association of NO2 (A), NOx (B), traffic load at major road fragments (C), and traffic intensity at the nearest road (D) with systolic BP and hypertension. Results are presented per given increments. I2 is a measure of heterogeneity between cohorts, and phet is a p-value for the Q-test of heterogeneity.