
Figure 1.
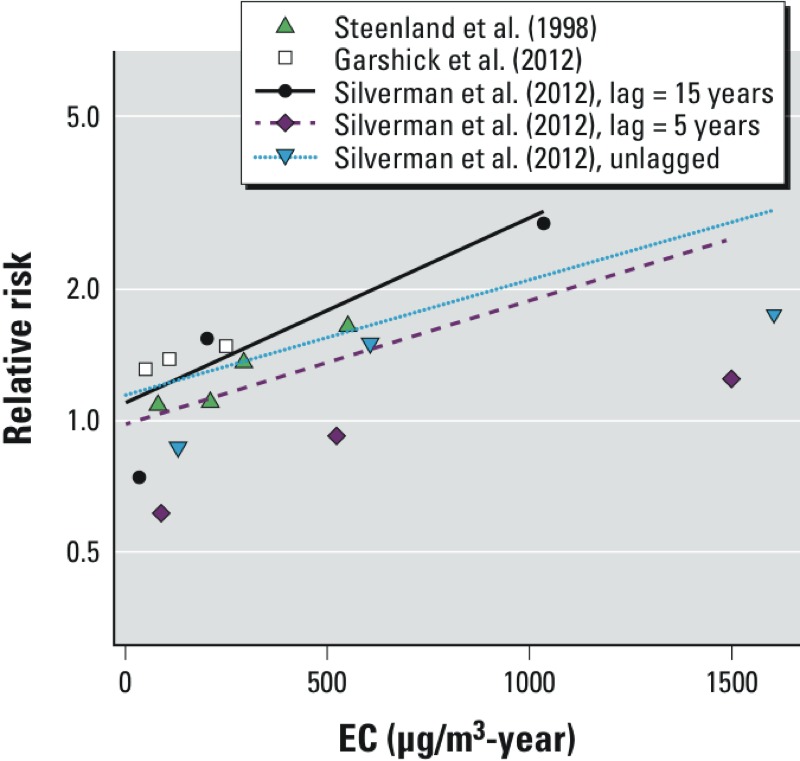
Predicted exposure–response curve of cumulative elemental carbon (EC) and lung cancer risk using different lag-times based on a log-linear regression model using relative risk estimates from the three cohort studies.
Official websites use .gov
A
.gov website belongs to an official
government organization in the United States.
Secure .gov websites use HTTPS
A lock (
) or https:// means you've safely
connected to the .gov website. Share sensitive
information only on official, secure websites.
Predicted exposure–response curve of cumulative elemental carbon (EC) and lung cancer risk using different lag-times based on a log-linear regression model using relative risk estimates from the three cohort studies.