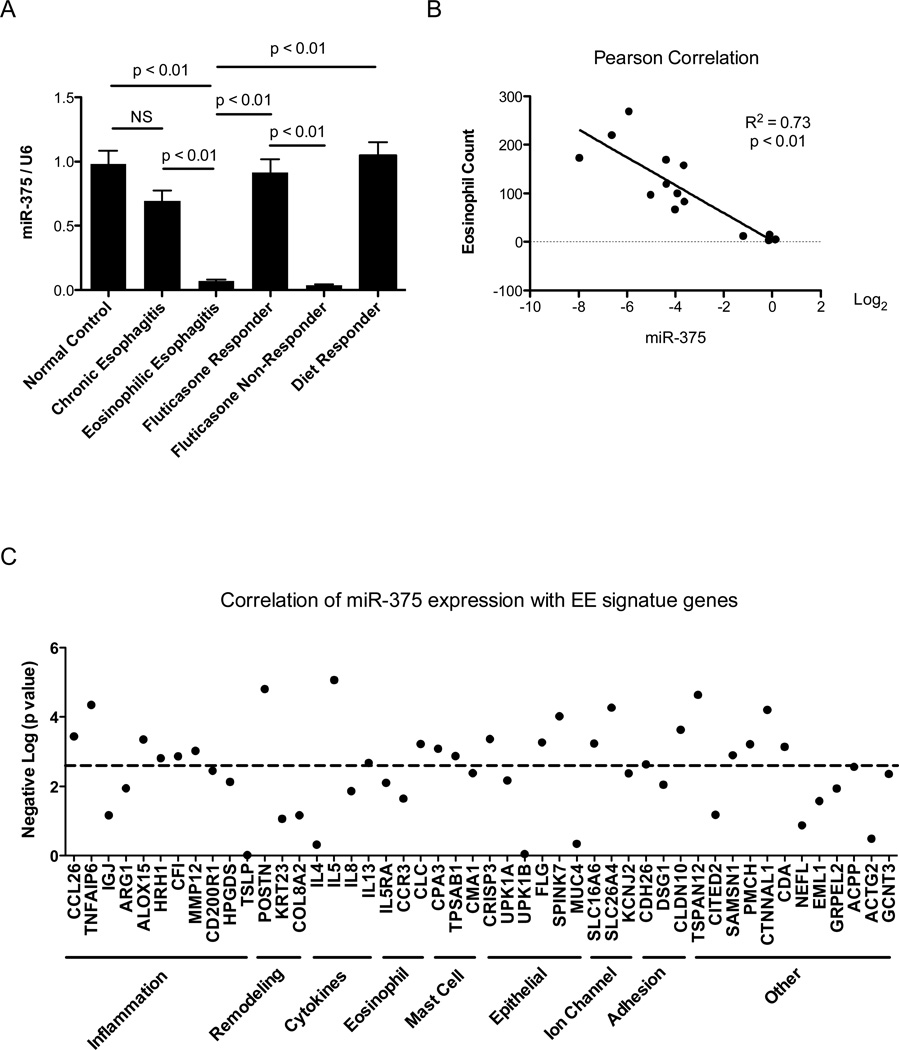
Figure 4. Expression of miR-375 in esophageal biopsies from EE patients and its correlation with esophageal eosinophil counts and EE signature genes.
(A) Expression of miR-375 in normal control, EE patients, chronic esophagitis patients, EE patients responsive to glucocorticoid therapy (fluticasone proprionate), EE patients unresponsive to glucocorticoid therapy and EE patients responsive to diet modification. Expression levels were determined by qPCR normalized to U6 small nuclear RNA. N = 8–15 patients per group; data are represented as mean ± S.E.M. (B) Correlation between miR-375 expression and esophageal eosinophil counts. (C) Correlation between miR-375 expression and EE signature genes. The significance of the correlation was plotted as the negative log of p value for each gene. The dashed line represents significance level after false discovery rate correction.

