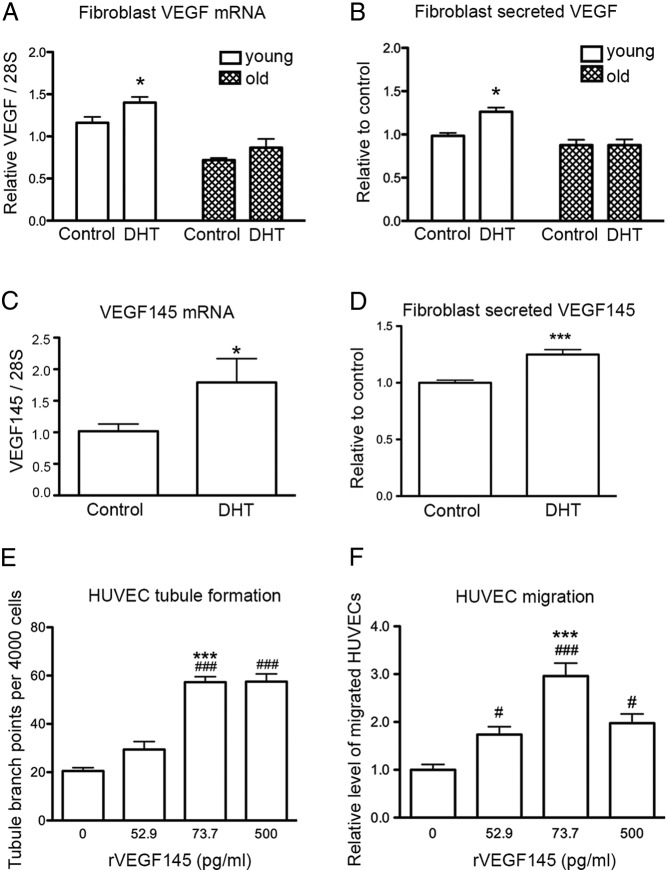
Figure 2.
The effect of DHT treatment on fibroblast VEGF production. A, Quantitative RT-PCR on VEGF mRNA levels in fibroblasts from young and old men after 48 hours of 40nM DHT treatment. Statistical analysis was performed using 2-way ANOVA with Bonferroni correction. *, P < .05 vs young control. B, The level of VEGF protein in CM from fibroblasts after 48 hours of DHT treatment using ELISA. Statistical analysis was performed using 2-way ANOVA with Bonferroni correction. *, P < .05 vs young control. C, VEGF145 isoform mRNA levels in fibroblasts from young men after 48 hours of 40nM DHT treatment analyzed by quantitative RT-PCR. Statistical analysis was performed using Student's t test. *, P < .05 vs young control. D, The levels of VEGF145 protein in CM from young fibroblasts after 48 hours DHT treatment using ELISA. Statistical analysis was performed using Student's t test. ***, P < .001 vs young control. E, Relative number of tubule branch points per 4000 HUVECs treated for 24 hours with rhVEGF145 at indicated concentrations. Statistical analysis was performed using one-way ANOVA with Bonferroni correction. ###, P < .001 vs untreated control; ***, P < .001; 73.7 pg/mL vs 52.9 pg/mL rhVEGF145-treated HUVECs. n = 3 donors of HUVECs performed in quadruplicate. Data presented as means ± SEM. F, Relative fold increase of migrated HUVECs per transwell, toward rhVEGF145 after 24 hours treatment. Statistical analysis was performed using one-way ANOVA with Bonferroni correction. ###, P < .001, 73.7 pg/mL rhVEGF145-treated HUVECs vs untreated; #, P < .05, 500 pg/mL rhVEGF145-treated HUVECs vs untreated; *** P < .001, 73.7 pg/mL vs 52.9 pg/mL rhVEGF145-treated HUVECs; n = 3 donors of HUVECs performed in duplicate with data presented as means ± SEM.

