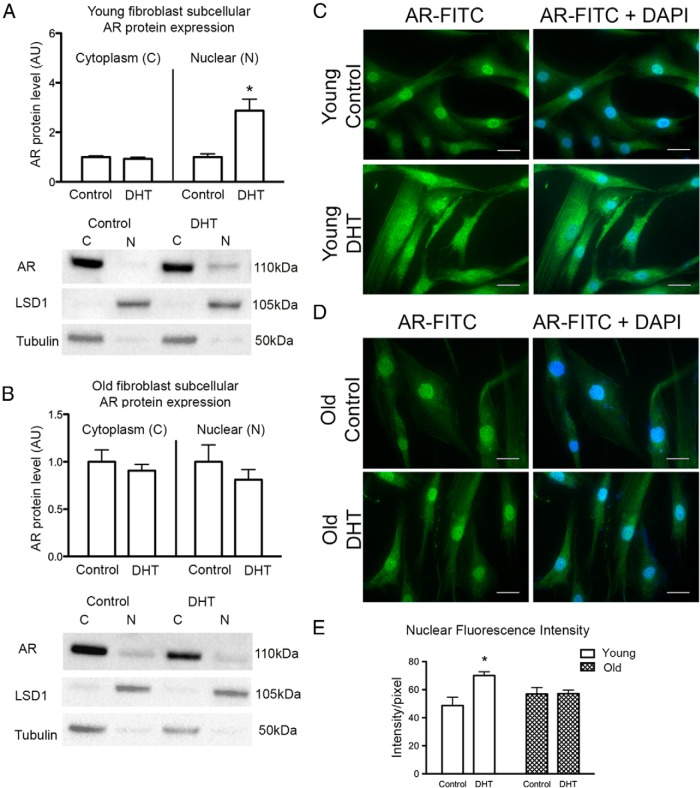
Figure 7.
The effect of DHT treatment on AR localization in fibroblasts from young and old men. Panel A, Cytoplasmic (C) and nuclear (N) expression of AR after subcellular fractionation of fibroblasts from young men subjected to 6 hours treatment with 40nM DHT. Statistical analysis was performed using Student's t test. *, P < .01 vs N control; n = 4 donors performed in quadruplicate over 3 individual experiments (means ± SEM). LSD1 and tubulin were used to demonstrate equal separation of nuclear and cytoplasmic fractions, respectively. Panel B, Cytoplasmic (C) and nuclear (N) expression of AR after subcellular fractionation of fibroblasts from old men subjected to 6 hours treatment with 40nM DHT. Statistical analysis was performed using Student's t test; n = 4 donors performed in quadruplicate over 3 individual experiments (means ± SEM). Panel C, Immunofluorescence localization of AR labeled with FITC (green) in untreated and 6 hours DHT-treated (40nM) fibroblasts from young men. Nuclei are stained blue with DAPI. Panel D, Immunofluorescence localization of AR labeled with FITC (green) in untreated and 6 hours DHT-treated (40nM) fibroblasts from old men. Nuclei are stained blue with DAPI. Bar, 30 μm. Panel E, Pixel fluorescence intensity of nuclear AR in young and old fibroblasts after 6 hours treatment with 40nM DHT. Statistical analysis was performed using 2-way ANOVA with Bonferroni correction. *, P < .05 vs young control.

