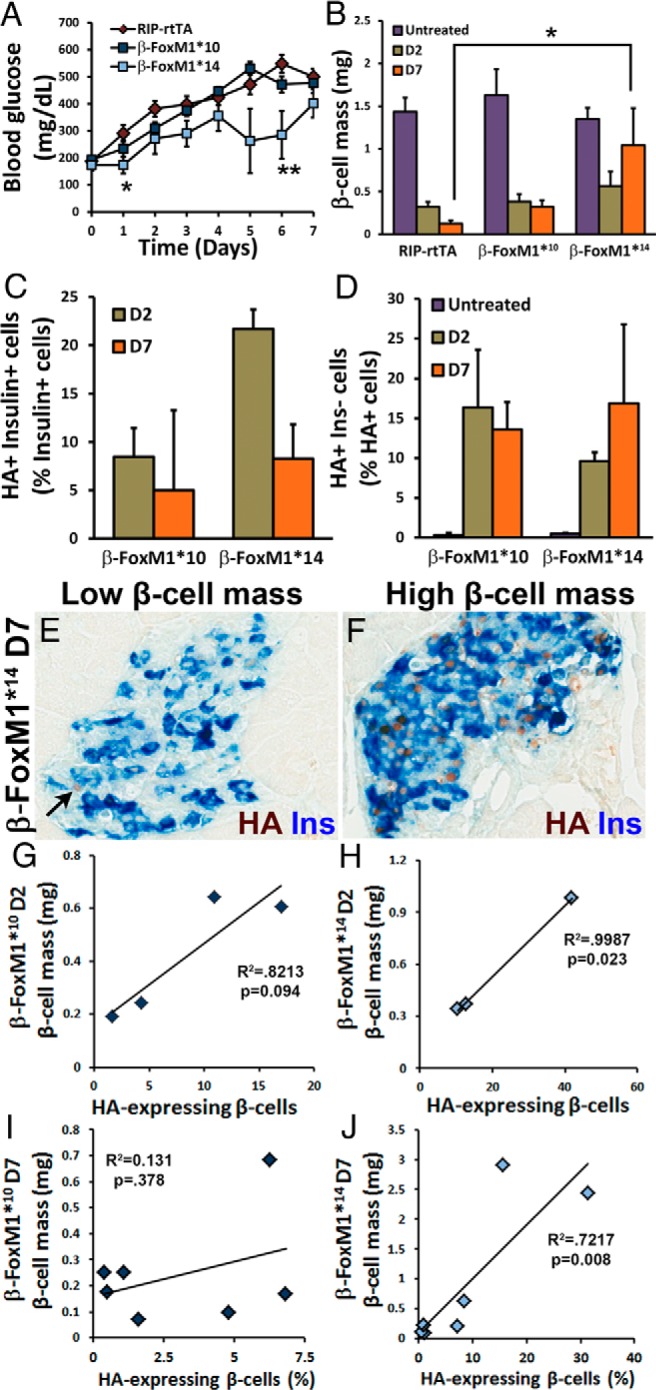
Figure 3.

Pretreatment with activated FoxM1 protects against β-cell mass loss and aids in β-cell mass recovery after treatment with STZ. A, β-FoxM1*14 mice display decreased ad libitum blood glucose compared with that of RIP-rtTA mice in the week after STZ administration (n = 7–14; *, P < .05). B, No difference in β-cell mass is observed after 2 weeks of Dox in either β-FoxM1* line without STZ treatment. At D2, no significant difference is observed in β-cell mass between RIP-rtTA and either line of β-FoxM1* mice. RIP-rtTA mice continue to lose β-cell mass between D2 and D7, but β-cell mass in β-FoxM1*10 mice plateaus between D2 and D7. β-FoxM1*14 mice exhibit higher β-cell mass at D7 than RIP-rtTA mice, and β-cell mass is increased in this line compared with that at D2. β-Cell mass in β-FoxM1*14 mice is significantly higher than that in RIP-rtTA mice by D7 after STZ treatment. β-FoxM1*10 mice display a trend toward an increase in β-cell mass by D7 (n = 3–5 for D2, n = 7–11 for D7; P < .05). C–J, The percentages of β-cells expressing HA-FoxM1ΔNRD at D2 and D7 after STZ treatment positively correlate with β-cell mass. C, HA-FoxM1ΔNRD expression in insulin+ cells (n = 3–4). D, HA-FoxM1ΔNRD expression in insulin− cells. E and F, Dox-treated β-FoxM1* mice with low β-cell mass 7 days after STZ treatment (E) express HA-FoxM1ΔNRD in fewer insulin (Ins)+ cells than β-FoxM1* mice with high β-cell mass (F). The arrow in E denotes an insulin− cell expressing HA-FoxM1ΔNRD. This correlation is quantified in both β-FoxM1*10 (G and I) and β-FoxM1*14 (H and J) mice at both D2 (G and H) and D7 (I and J).
