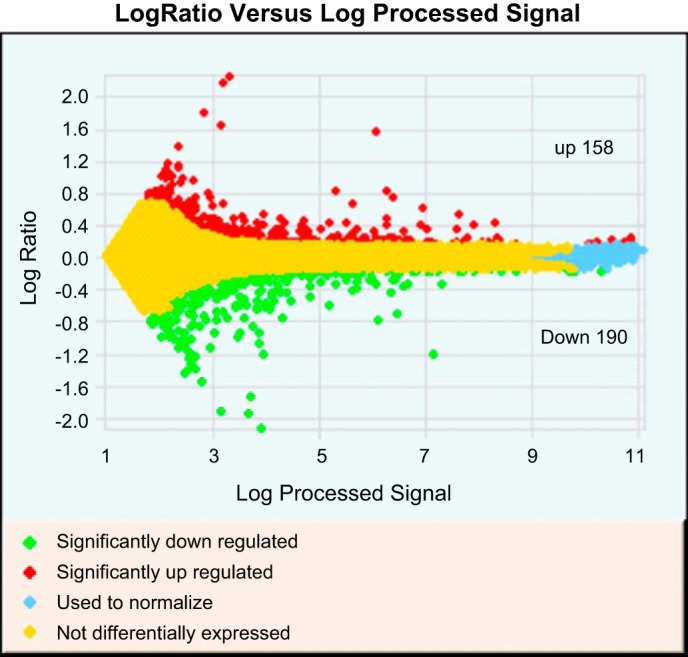
Fig. 1.

A scatterplot depicting the distribution of significantly altered genes between gestational salt-stressed Bdkrb2−/− and Bdkrb2+/+ kidneys at embryonic day (E) 14.5. Red, upregulated; yellow, unaltered; green, downregulated (P < 0.05, >1.5-fold).
