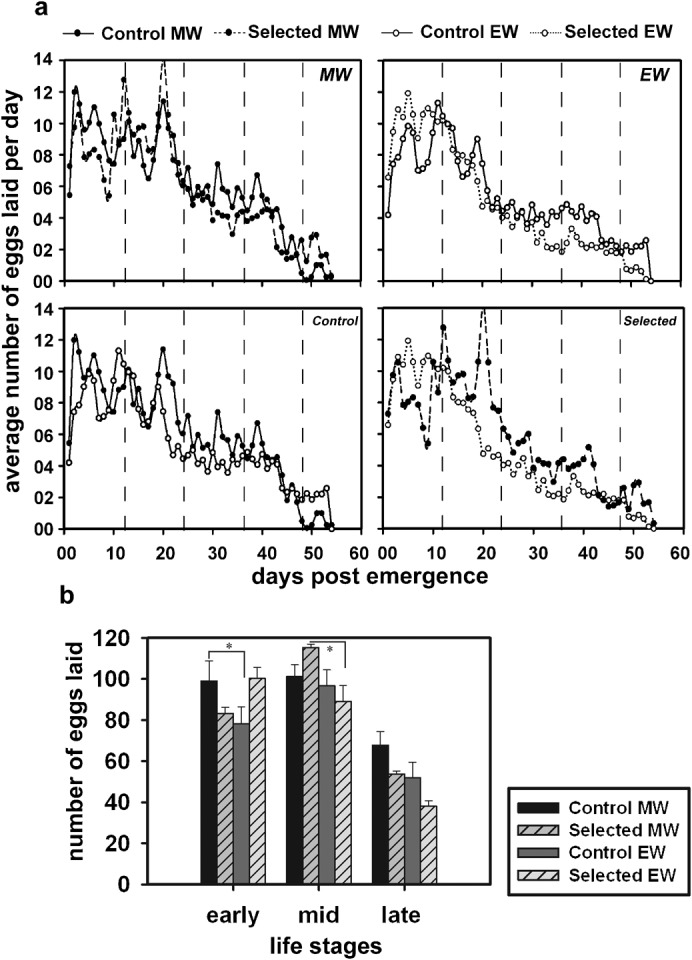
Fig. 3. Lifetime fecundity and fecundity across age blocks in flies from the selected and control populations emerging in the morning and evening windows.

(a) Top panels show comparisons of lifetime fecundity between the selected and control flies emerging in the same window whereas bottom panels show comparisons across the emergence windows. The number of eggs laid on a particular day averaged across individuals is plotted against the age of the fly measured as days after emergence. The dotted lines represent the divisions of the lifetime into relevant age blocks, which are then pooled and analysed in the bottom-most panel. (b) Comparison of fecundity of the selected and control flies across early (1–12), mid (13–24) and late (25–36) life stages. The very late last stage was excluded since very few flies survived until 48 days. The sample sizes of flies that survived until the age of 36, and were thus used for analyses were n = 43 and n = 47 for the morning and evening emerging windows, respectively, for the selected populations, and n = 49 and n = 48 for the morning and evening emerging windows, respectively, for the control populations. A total of ∼45 females each from the morning and evening emerging flies from the selected and control populations was used (yielding an overall sample size of n = 187). Error bars are SEM. Significant differences of p<0.05 from post-hoc comparisons are denoted by asterisks.
