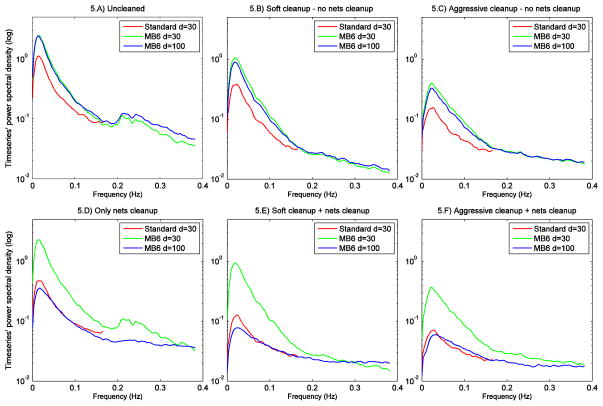
Fig. 5.
Temporal power spectra of the different protocols for each cleaning option. The spectra were obtained by averaging the single subjects’ spectra (from timeseries scaled using the amplitude of uncleaned data) and calculating median spectra across components, without normalisation for high frequency power. Y axis in logarithmic scale.

