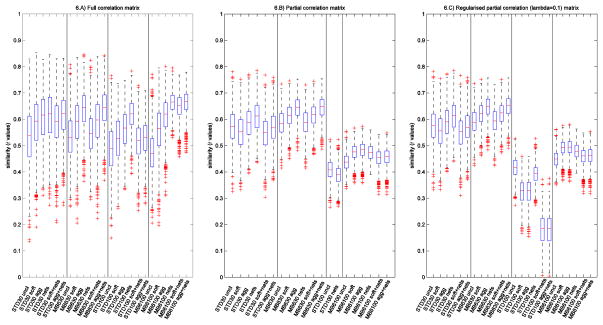
Fig. 6.
Networks’ similarity across subjects. The boxplots show the correlation coefficients (full correlation, partial correlation, and regularised ICOV) between network matrices (unwrapped into a vector of network matrix edges) for all pairs of subjects, with different cleaning steps and for different protocols. ICOV= L1-regularised partial correlation; STD=Standard sequence; uncl=uncleaned; soft=FIX soft cleaning; agg=FIX aggressive cleaning; nets=Nets cleaning.

