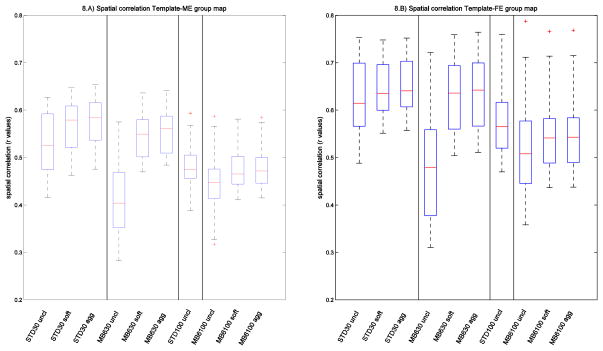
Fig. 8.
Spatial correlations. The boxplots show the distributions across components of the correlation coefficients between the group maps (obtained with ME and FE statistics) and the corresponding templates, for different cleaning approaches and for different acquisition protocols. STD=Standard sequence; uncl=uncleaned; soft=FIX soft cleaning; agg=FIX aggressive cleaning.

