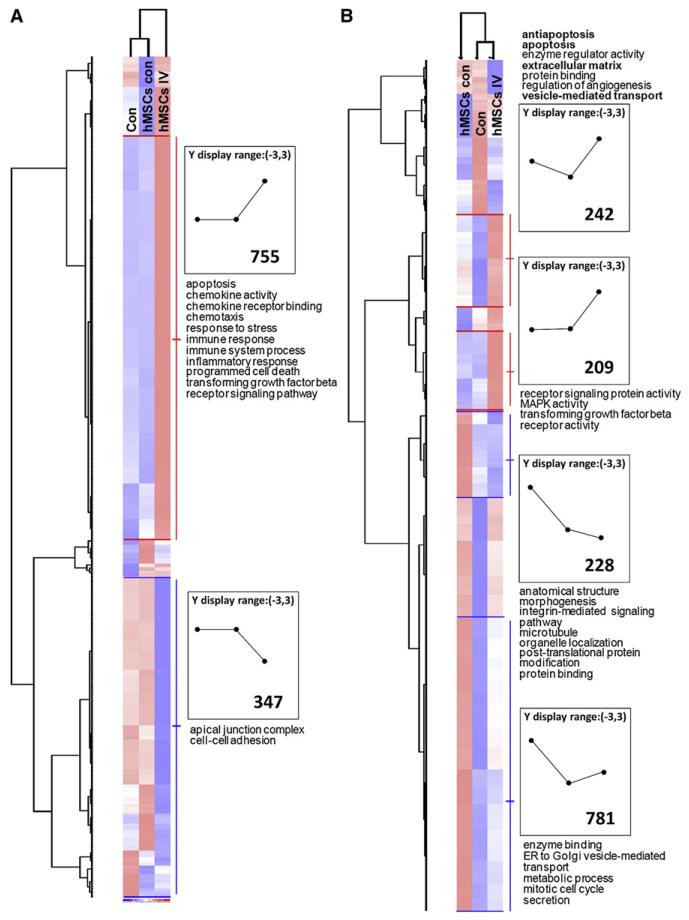
Figure 2. Heat Map of Microarray Assays of Mouse Lungs after I.v. Infusion of hMSCs.
About 2 × 10⁶ hMSCs were infused i.v., and lung RNA was recovered 10 hr later for assays on both mouse-specific and human-specific microarrays (Affymetrix, Santa Clara, CA). Data were filtered for cross-hybridization (CV > 0.5 and call > 33%), analyzed with the Microarray Suite 5.0 program, and normalized to a value of 1 and variance of 3 SD (+3, red; 3, blue). Gene ontology categories of genes are indicated. The number of genes with expression differences is indicated in the boxes.
(A) Assay on mouse-specific chip.
(B) Assay of same RNA on human-specific chip. Symbols: con, lung from control mouse; hMSCs con, sample of hMSCs added to lung from control mouse before extraction of RNA; hMSCs i.v., sample from mouse lung 10 hr after i.v. infusion of hMSCs.

