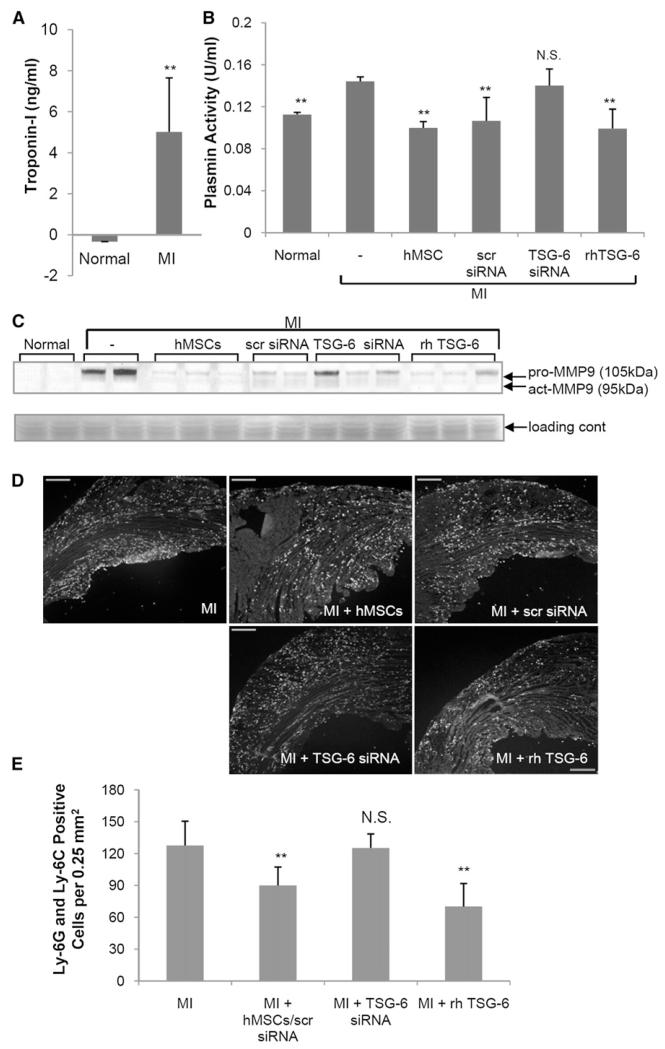
Figure 4. Assays of Serum and Heart.
(A) Assay for cardiac troponin I in serum 48 hr after MI. Values are ± SD; **p < 0.01 with n = 3 (normal) or six mice (MI) per group.
(B) Plasmin activity in serum 48 hr after MI. Symbols: Normal, naive mice; −, MI only; hMSCs, 2 × 10⁶ hMSCs infused i.v. 1 hr after MI; scr siRNA, 2 × 10⁶ hMSCs transduced with scrambled siRNA infused i.v. 1 hr after MI; TSG-6 siRNA, 2 × 10⁶ hMSCs transduced with TSG-6 siRNA infused i.v. 1 hr after MI; rhTSG-6, 30 μg rhTSG-6 protein infused i.v. 1 hr and again 24 hr after MI. Values are ± SD; **p < 0.01 with n = 3 mice per group. N.S., not significant.
(C) Hearts assayed for pro- and active-matrix MMP9 on a gelatin zymogen gel 48 hr after MI. Image is reversed. Symbols are as in (B).
(D and E) Granulocyte and monocyte infiltration in the heart 48 hr after MI. Sections stained with anti-Ly-6G and Ly-6C. Symbols are as in (B), except that 100 μg rhTSG-6 protein was infused i.v. 1 hr and again 24 hr after MI. Magnification ×4. Scale bars, 250 μm. Values are ± SD; n = 3 or 4 for each group. **p < 0.001; N.S., not significant.

