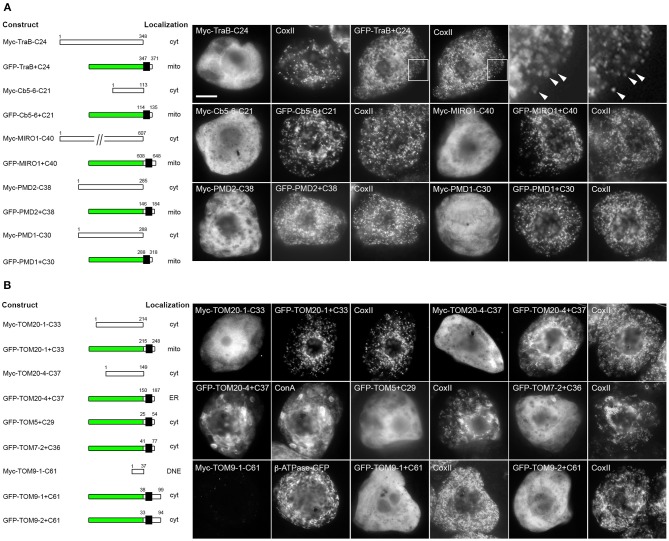
Figure 3.
Localization of various C-terminal mutant and GFP fusions of selected mitochondrial-TA proteins in BY-2 cells. Shown on the left in both (A) and (B) are schematic illustrations of various C-terminal-mutant (i.e., truncated) versions or GFP fusions of various dibasic-motif-containing TA proteins (A) or TOM-TA proteins (B) and their corresponding intracellular localization in transformed BY-2 cells. The numbers in the name of each construct denote the number of residues that were either deleted from the C terminus of the Myc-tagged wild-type TA protein or fused to the C terminus of GFP, and the numbers above each illustration correspond to the N- and C-terminal amino acid residues of the TA protein. Portions of the TA protein are represented in the illustrations by white and black boxes, the latter denoting the putative TMD; green boxes denote GFP. Cyt, cytoplasm; DNE, did not express; ER, endoplasmic reticulum; mito, mitochondria. Shown on the right in both (A) and (B) are representative immuno-epifluorescence micrographs illustrating the localization of the various constructs shown on the left. Each micrograph is labeled with the name of either the transiently-expressed Myc-tagged C-terminal mutant or GFP fusion protein, the endogenous mitochondrial marker protein, CoxII, or ConA. Boxes in the top row of (A) represent the portions of cells shown at higher magnification in the panels to the right. Arrowheads indicate examples of the torus-shaped fluorescent structures containing GFP-TraB+C24 delineating the spherical structures attributable to matrix-localized CoxII, indicating that GFP-TraB+C24 localizes to the OMM. For all other expressed proteins, only general (i.e., lower magnification) fluorescence patterns were compared with those of mitochondrial CoxII or, in the case of GFP-TOM20-4+C37, ConA-stained ER. Note also that cells transformed with Myc-TOM9-1-C61, which did not display a detectable immunofluorescence signal, were identified based on the fluorescence attributable to co-expressed β-ATPase-GFP, serving as cell transformation and mitochondrial matrix marker protein. Bar in (A) = 10 μm.

