
Figure 2.
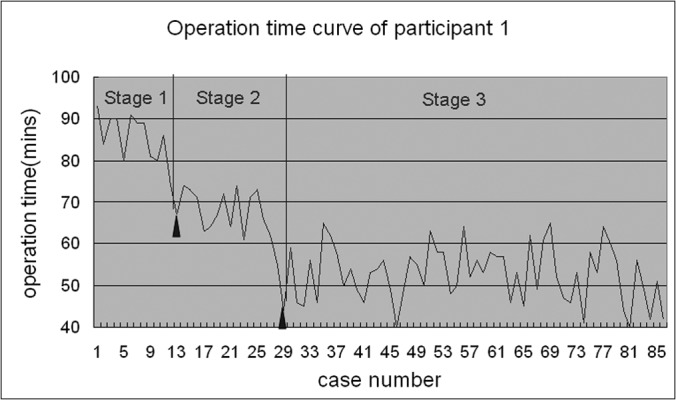
This operation time curve of participant 1 clearly showed 2 sharp decline points (triangles ▴ point to the 12th case and the 27th case), which divided the learning, improving, and platform stages, which were later proved by statistical analyses.