
Figure 2.
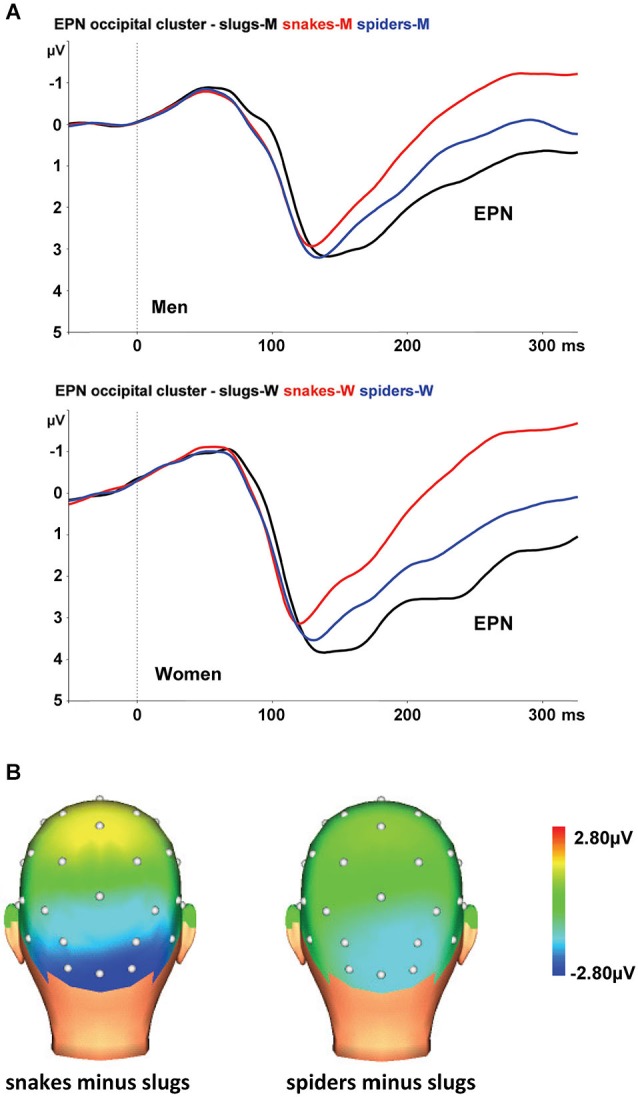
(A) The EPN in response to snake (red lines), spider (blue lines), and slug pictures (black lines) at the occipital cluster (Oz, O1/2, PO3/4) in men and women. (B) Topographic maps of the differences in EPN mean amplitudes (225–300 ms), across men and women, between snake vs. turtle pictures (left) and between crocodile vs. turtle pictures (right).