
Figure 4.
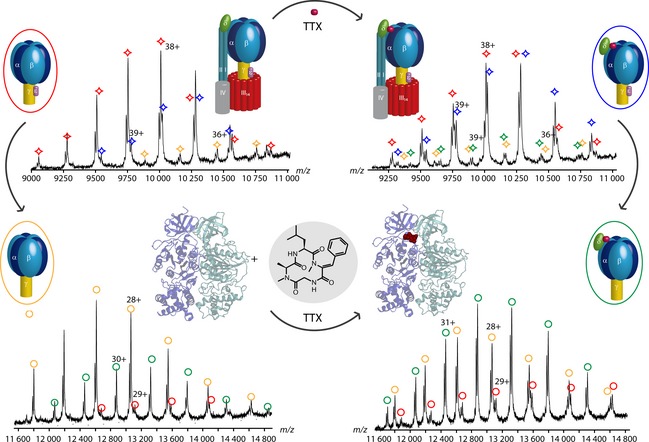
TTX binding to cATPase. The upper mass spectra were acquired before (left) and after (right) incubation with TTX. Without TTX, the dominant complex species is the F1–δ‐cATPase. The intact F1 and F1–δ–ε complexes are present at lower intensities. The intensity of the intact F1‐cATPase increased after TTX binding, leading to two main complexes, the F1‐cATPase and the F1–δ‐cATPase. Upon CID fragmentation (lower mass spectra), the ε‐subunit dissociates, mainly yielding the F1–δ–ε‐cATPase without TTX (left). CID fragmentation of the TTX‐bound cATPase results in an intensity change of the CID products. Loss of the ε‐subunit in the TTX‐bound complex leads primarily to formation of the F1–ε complex. The crystal structures of the spinach ATPase with (Protein Data Bank ID PDB 1KMH, right) and without (Protein Data Bank ID PDB 1FX0, left) TTX, as well as the structure of TTX, are shown.