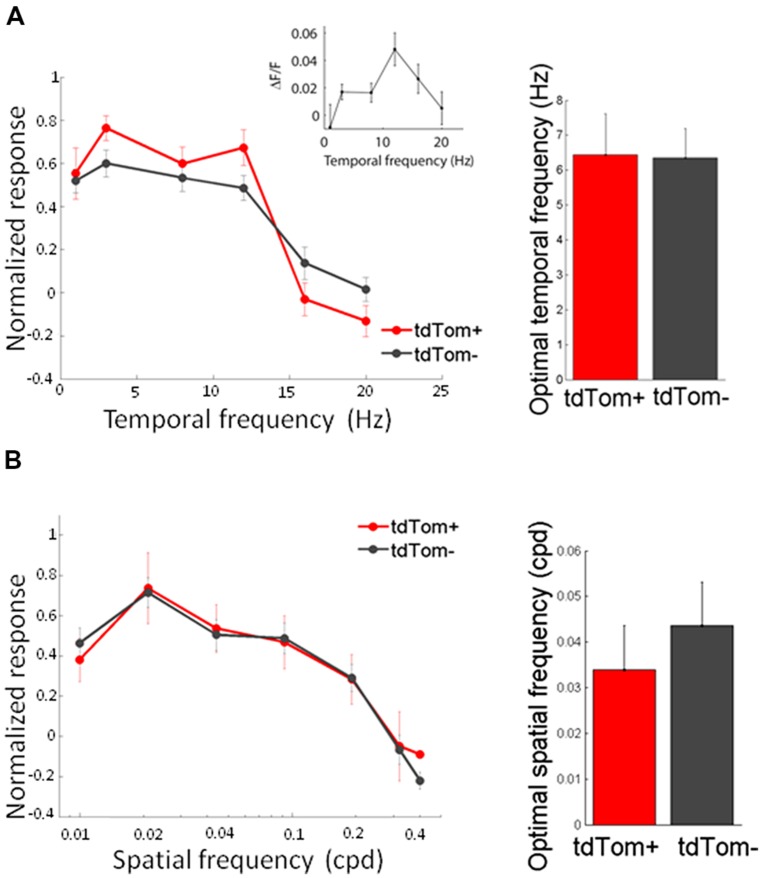
FIGURE 4.
Temporal and spatial frequency tuning of tdTom+ neurons is like the general population. (A) Left, population average tuning to temporal frequency are not different for tdTom+ and tdTom- groups. Inset, example tuning of a tdTom+ neuron. Right, mean optimal temporal frequencies are identical. Error bars show SEM. (B) Left, population response tuning to spatial frequency is the same for tdTom+ and tdTom- groups. Right, mean optimal spatial frequencies are not different. Error bars show SEM.

