FIGURE 5.
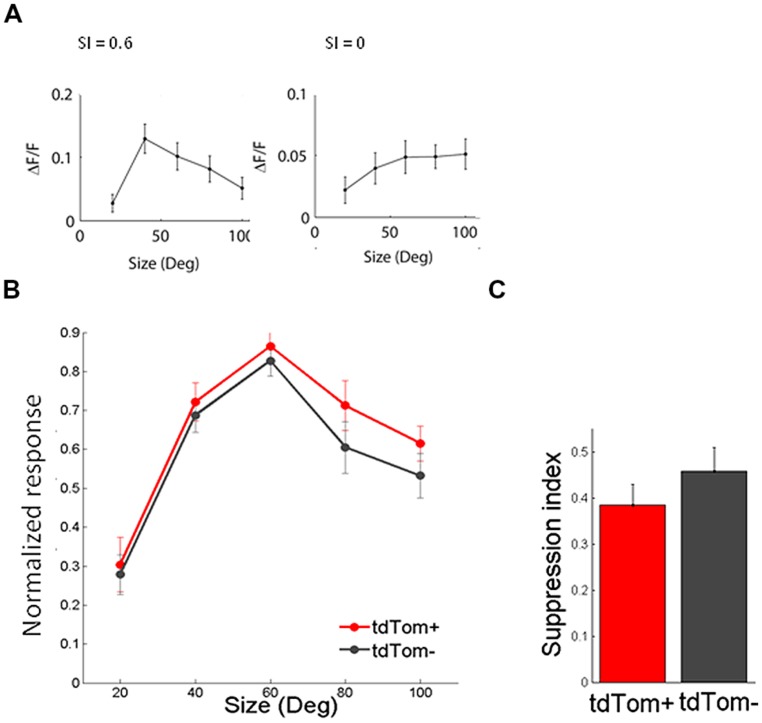
Size tuning of tdTom+ is like the general population. (A) Example tuning of two tdTom+ neurons to visual stimulation of a circular patch of different sizes, and their corresponding Suppression Index values. (B) Population average of normalized response to differently sized gratings are not different for tdTom+ and tdTom- groups. Error bars are SEM. (C) Mean suppression index is not different for the two groups. Error bars are SEM.

