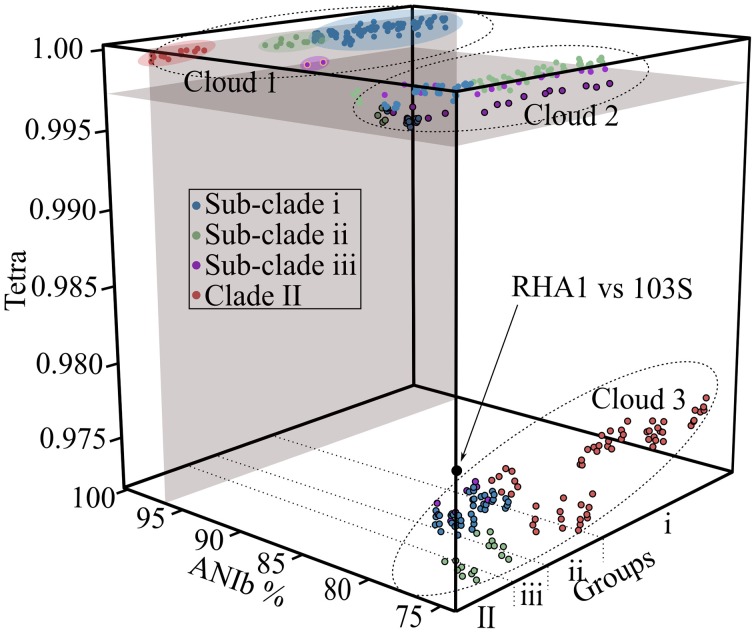
Figure 2.
Cloud plot of ANIb vs. TETRA for all possible pairwise comparisons. Average nucleotide identity (ANIb; x-axis) and tetranucleotide (TETRA; y-axis) usage patterns were calculated and plotted as a factor of isolate grouping (z-axis). All pairwise comparisons, including reciprocal comparisons are presented, with colors assigned based on the clade membership of the isolate being compared to. Gray colored areas demark 96% ANI and 0.997 TETRA thresholds. Clouds are demarcated by dotted lines. Circles with black borders are below the TETRA threshold. Circles with yellow borders (comparisons between isolates of sub-clade iii; purple) exceed the TETRA threshold but not the ANIb threshold. The black circle represents a comparison between R. jostii RHA1 and R. equi 103S.

