
Fig. 2.
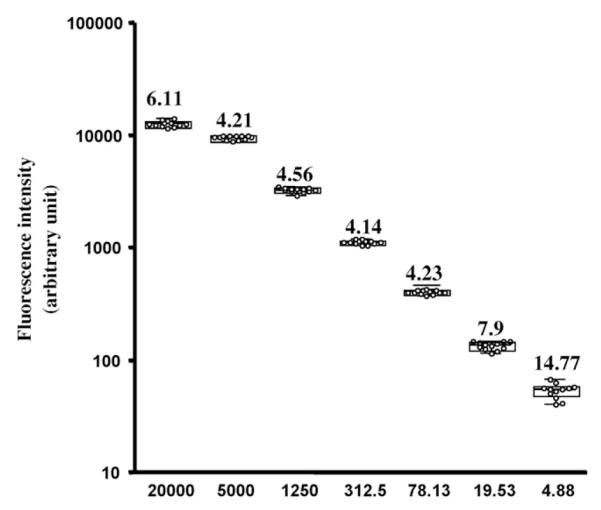
Inter assay variation.
The figure represents the inter assay variation calculated for 4 assays run in triplicates at different concentrations. For each concentration, all the data points (12 per concentration) are plotted together with the median, the interquartile box, and the range of the data. The number above each data point represents the CV of the results at the corresponding concentration.