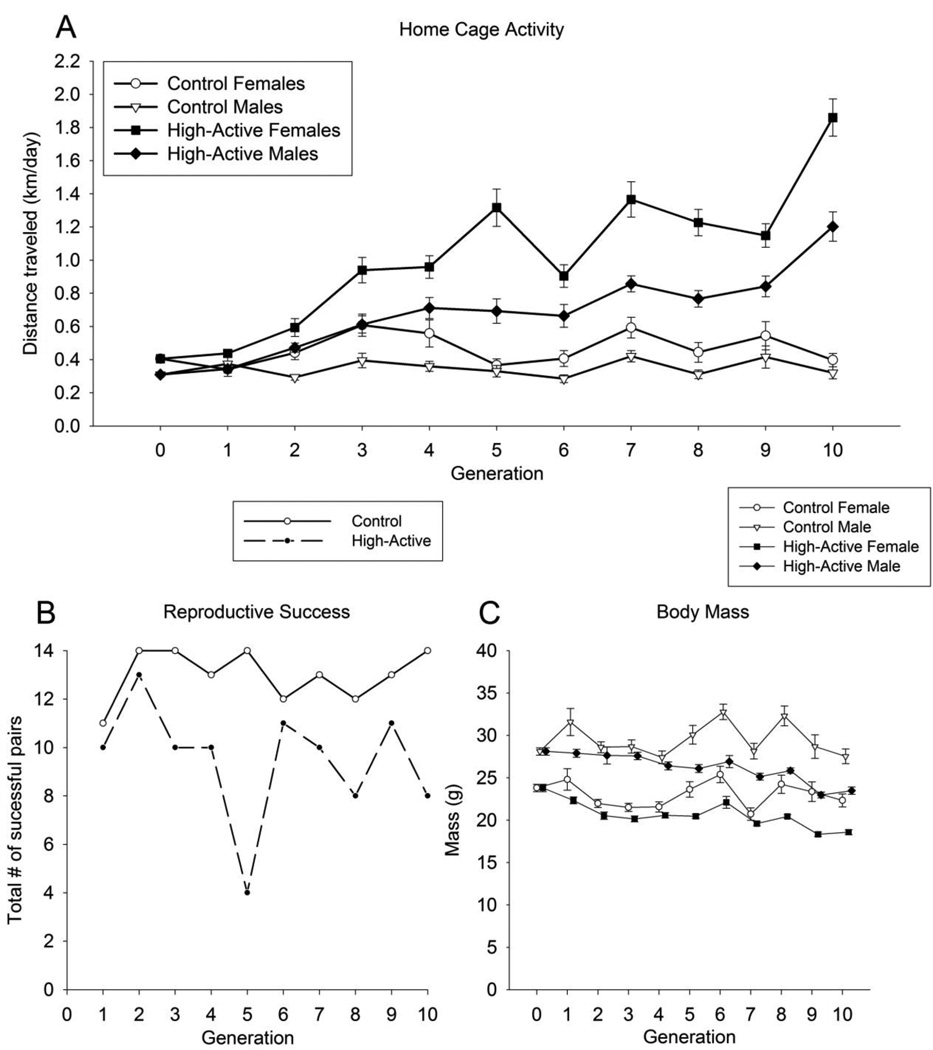
Figure 2. Home cage activity, reproductive success and body mass across generations.
A) Data points represent the population means (±SE) from each generation for home cage activity (distance traveled on days 5 and 6 in km/day). Males and females are plotted separately. B) Every generation, 14 pairs of High-Active mice and 14 pairs of Control mice were paired to produce the next generation. The total number of successful pairings from each line for generation are represented here (14 max). C) Average body mass (±SE) at the time of home cage phenotyping, PND 60–66. Males and females are plotted separately.

