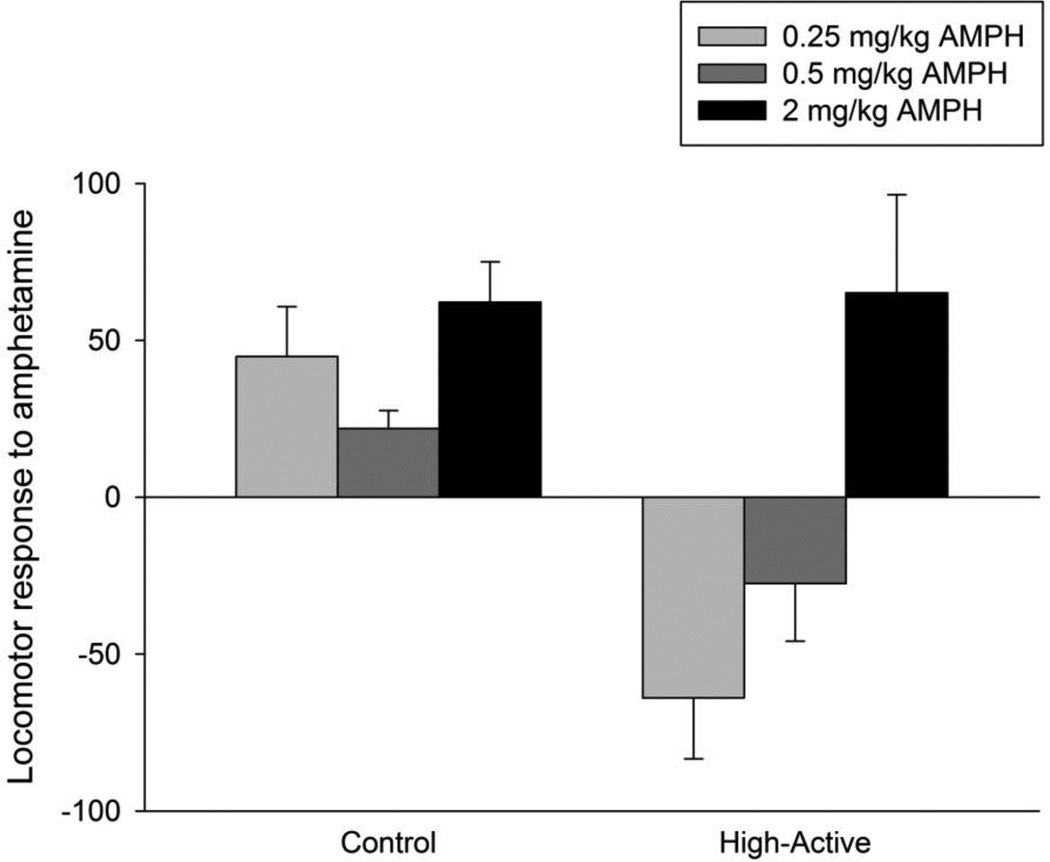
Figure 5. Locomotor response to amphetamine.
Average (±SE) locomotor response to 0.25, 0.5, and 2 mg/kg amphetamine in the Control and High-Active lines. Response was calculated for each individual receiving amphetamine as the distance traveled 90 minutes after administration of amphetamine minus the average distance traveled by the saline group from the same sex and line. Hence negative values indicate a suppression of locomotor activity from amphetamine whereas positive values indicate stimulation. Results are shown collapsed across sex (n=8/line/treatment = 64 total).

