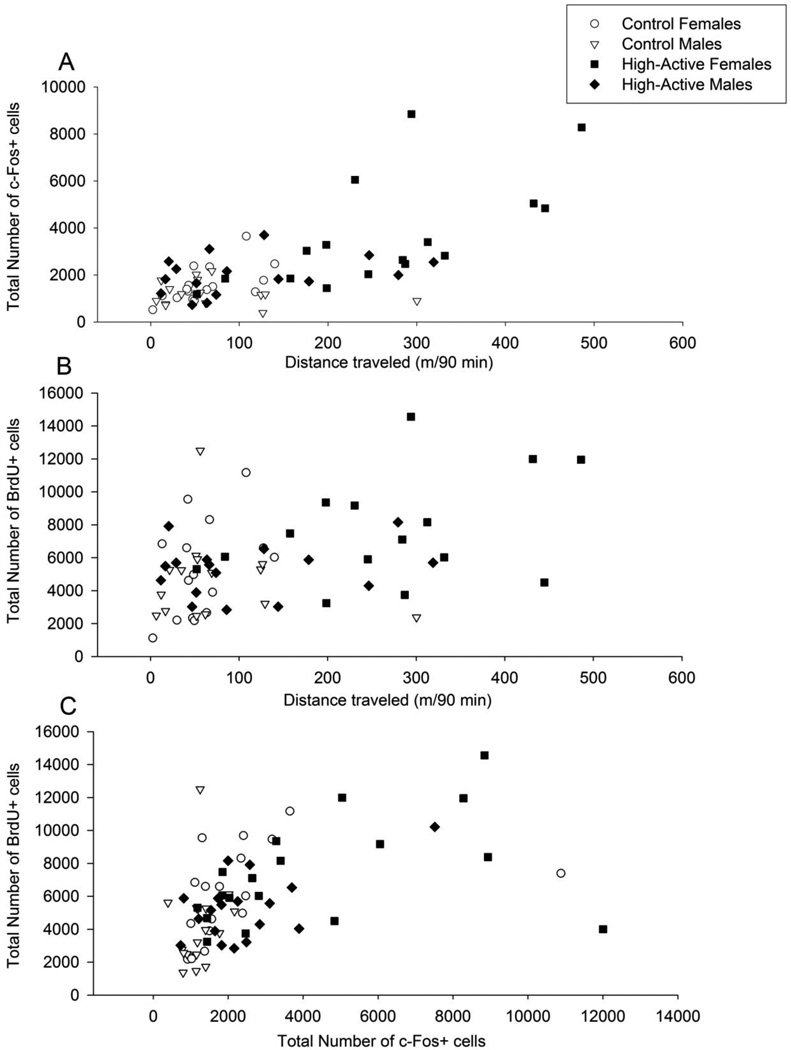
Figure 8. Correlations between cellular activation, growth of new cells in the dentate gyrus, and locomotion.
A) Phenotypic correlation between total number of c-Fos+ cells and distance traveled (m) within the 90 minute period prior to euthanasia (n=4/sex/line/treatment = 64 total). B) Same as A for BrdU+ cells. C) Phenotypic correlation between total number of c-Fos+ cells and total number of BrdU+ cells for all mice, regardless of whether they underwent video tracking (n=5/sex/line/treatment = 80 total).

