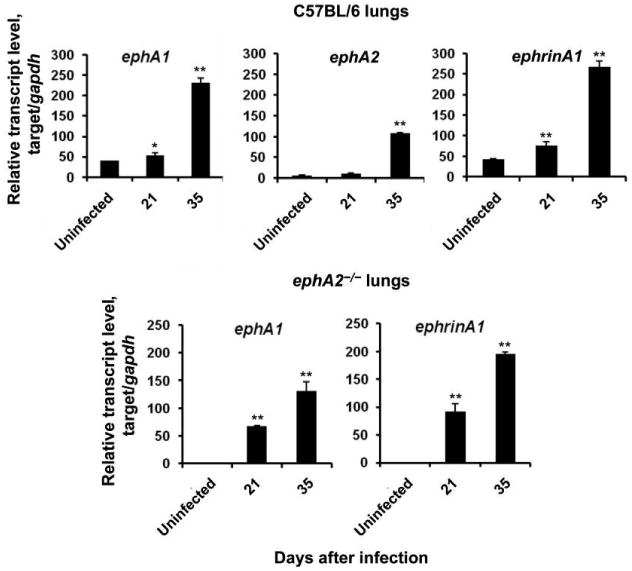
Figure 1.

Expression of erythropoietin-producing hepatoma (Eph) A transcripts and their ligand, EphrinA1. Transcript levels of ephA1, ephA2, and ephrinA1 in the lungs of normal C57BL/6 mice and ephA2−/− mice were quantified by real-time polymerase chain reaction. Data are relative transcript levels normalized against the gapdh gene and represent the means ± standard deviations of values from 3 independent experiments. *P < .05; **P < .01.
