
Figure 3.
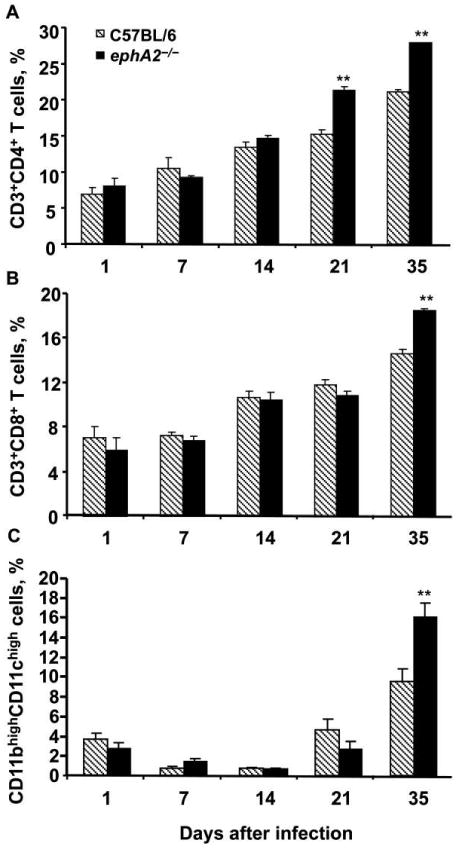
Greater abundance of CD4+ and CD8+ T cells as well as dendritic cells (DCs) in ephA2−/− mice than in normal C57BL/6 mice after infection with Mycobacterium tuberculosis. The percentages of total lymphocytic cells that were CD3+CD4+ (A) and CD3+CD8+ (B) T cells in the lungs of ephA2−/− mice and C57BL/6 mice were determined by flow cytometry using CD3, CD4, and CD8 surface markers. The percentage of the total macrophage and monocytic cell population that were DCs (C) was determined on the basis of their level of CD11b and CD11c surface expression. Data are the means ± standard deviations of values from all mice in the same group (n = 4). The key in panel A applies to all other panels. **P < .01.