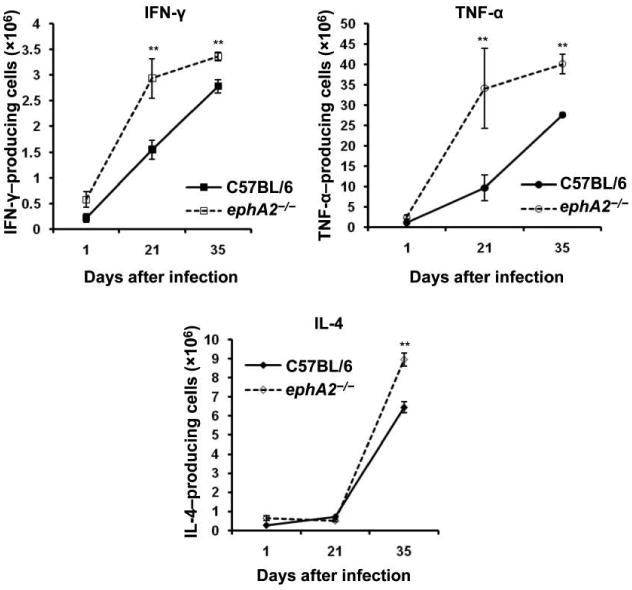
Figure 5.

Cytokine production in the lungs during Mycobacterium tuberculosis infection. Cytokine levels were measured by intracellular staining and flow cytometry of lung cell suspensions. Data are the absolute no. of cytokine-producing cells per lung and represent the mean ± standard deviation of values from each mouse (n = 5) per group and per time point. IFN, interferon; IL, interleukin; TNF, tumor necrosis factor. **P < .01.
