
Figure 5. Selection and Optimization of PF Ependymoma Group A- and Group B-Specific IHC Markers.
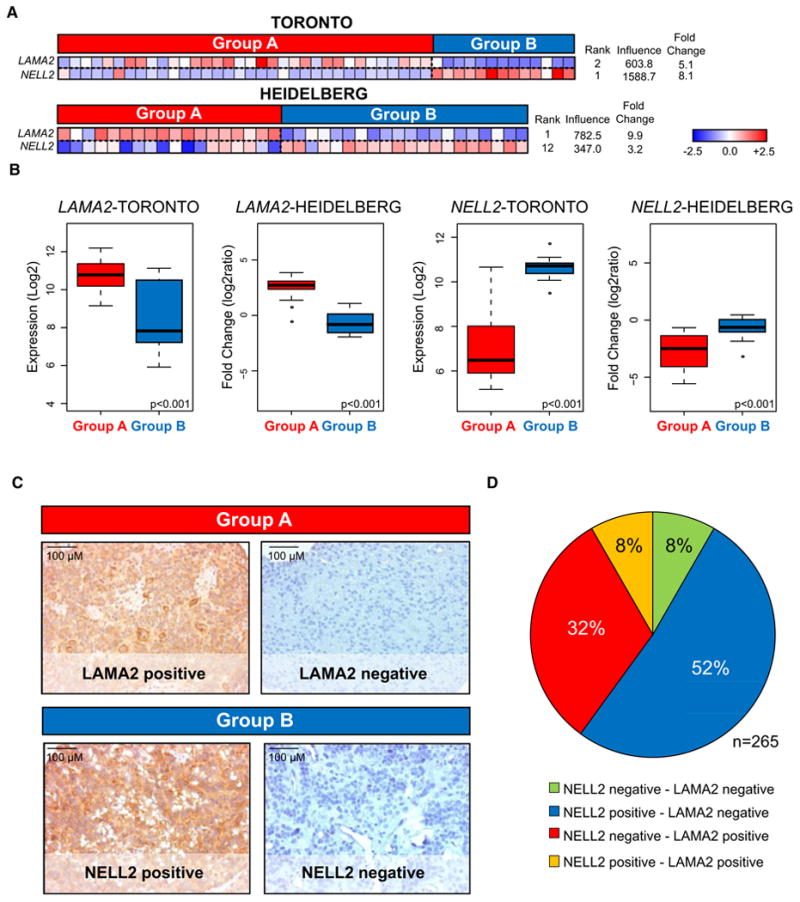
(A) Subgroup-specific expression patterns of selected markers, LAMA2 and NELL2, illustrated by heatmaps in both datasets. Candidate genes were identified using the Goeman's global test, which assigns a score to each gene based upon its degree of discrimination between defined classes: Group A and Group B.
(B) Box plots derived from mRNA expression data displaying overall differences between markers representing Group A (LAMA2) and Group B (NELL2) in the Toronto and Heidelberg cohorts. Comparisons were performed using an unpaired t-test.
(C) Representative immunohistochemistry (IHC) staining of LAMA2 and NELL2 on an ependymoma tissue microarray (TMA) composed of 265 PF ependymomas.
(D) Pie chart illustrating the distribution of TMA staining for NELL2 and LAMA2. Eight-four percent of posterior fossa ependymomas stain positive for a single marker.
See also Table S3 and Figure S5.