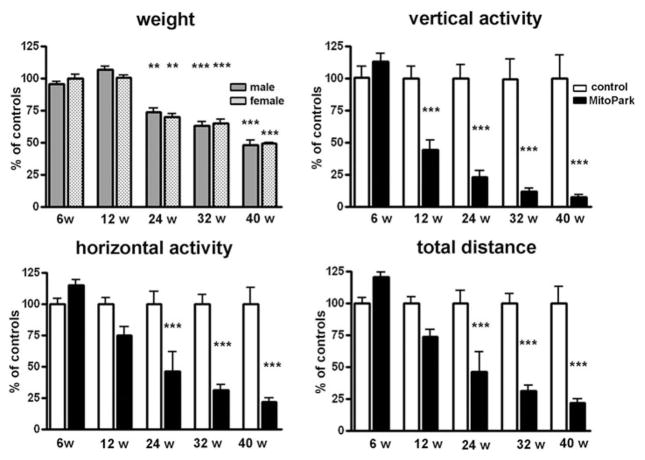
Figure 1. Changes in weight, spontaneous vertical activity, horizontal activity and total distance traveled of MitoPark mice as a percentage of control littermates at five different ages.
Bars represent mean beam breaks from six to eight animals per group and error bars indicate SEM. Data were analyzed with two-way ANOVA followed by Bonferroni post test and statistically significant differences to aged matched controls are indicated as follows: *, P < 0.05; **, P < 0.01; ***, P < 0.001.

