
Figure 3. Mean horizontal and, respective, vertical activities during 60 min following treatment with 4 or 20 mg/kg of L-DOPA of MitoPark mice at four different ages.
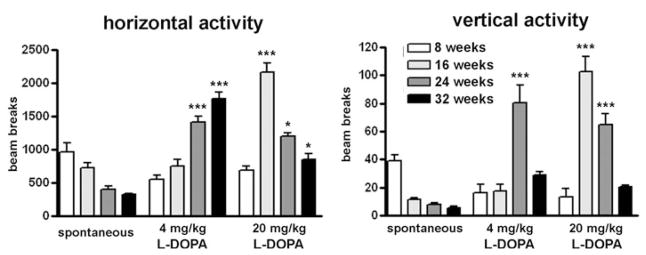
The drug-induced activity is compared with their spontaneous locomotor activity 60 min before the injection. Bars represent mean beam breaks from six to eight animals per group and error bars indicate SEM. Data were analyzed with two-way ANOVA followed by Bonferroni post test and statistically significant differences to the spontaneous activity are indicated as follows: *, P < 0.05; **, P < 0.01; ***, P < 0.001.