
Figure 5. Monoamine levels in anterior cortex cerebri of MitoPark mice at five different ages compared with their wild-type littermates.
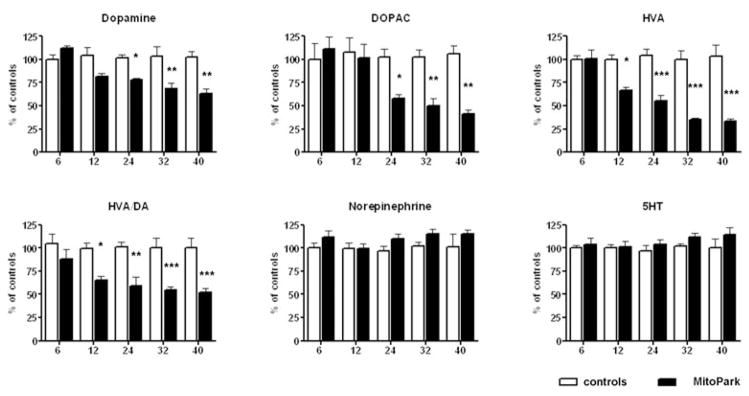
Bars represent mean monoamine levels from six to nine animals per group and error bars indicate SEM. Data were tested with two-way ANOVA followed by Bonferroni post test and statistically significant differences to aged matched controls are indicated as follows: *, P < 0.05; **, P < 0.01, ***, P < 0.001.