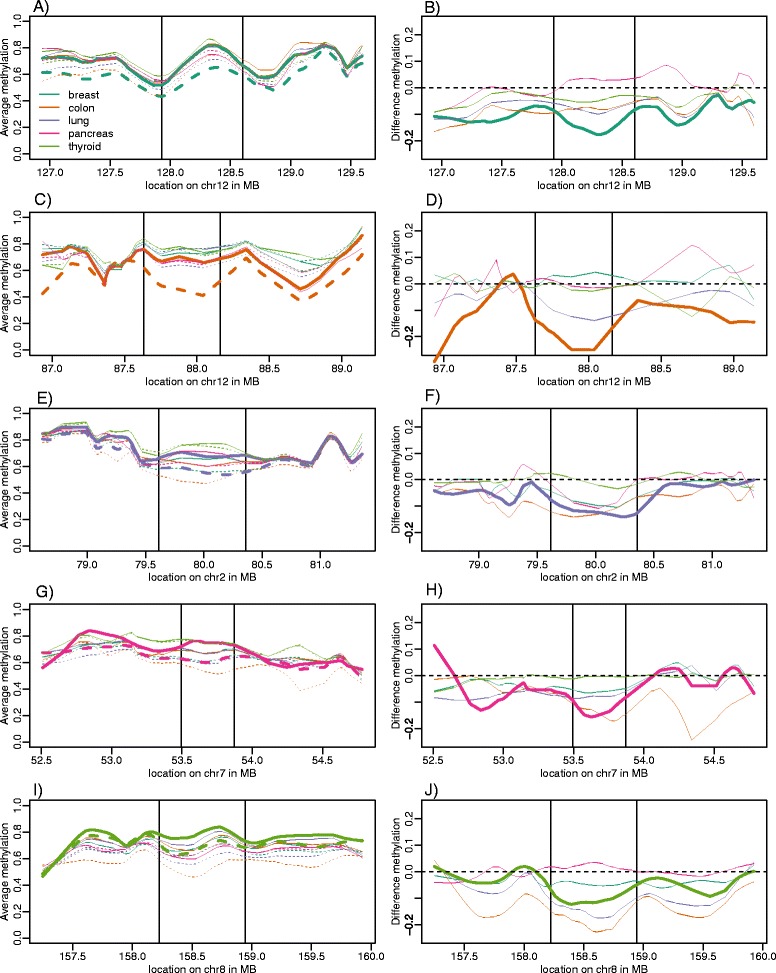
Figure 2.

Illustrative blocks of aberrant methylation in cancer. Examples of a hypomethylated block. (A) Methylation values in normal and cancer samples for a block found in breast cancer, which is highlighted with a thicker line. (B) As (A) but showing difference between cancer and normal samples. The same plots are shown for colon (C, D), lung (E, F), pancreas (G, H), and thyroid (I, J).
