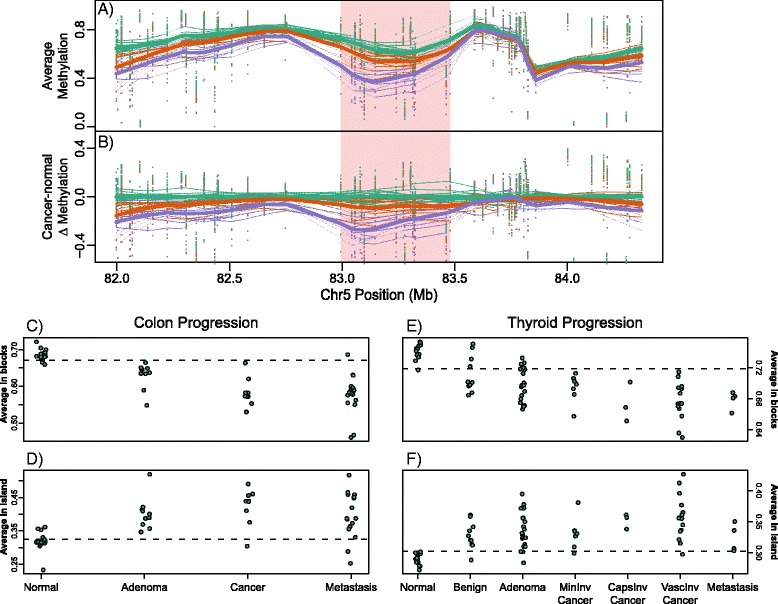
Figure 4.

Hypomethylated blocks occur early in cancer and increase with progression. (A) Across-individual methylation averages for colon normal (green), adenoma (orange), and cancer (purple). The hypomethylated block in cancer is shown in pink. The points represent sample-specific values. Thick lines represent the sample type average, thin lines are each sample. (B) As (A) but the difference from the average normal. (C, D) Summarized average methylation values for blocks (C) and islands (D) in colon normal, adenoma, carcinoma, and metastasis samples. (E, F) Summarized average methylation values for blocks (E) and islands (F) in thyroid normal, benign hyperplastic (adenomatoid nodules), adenoma, minimally invasive carcinoma, capsular invasive carcinoma, vascular invasive carcinoma, and metastatic samples.
